Navi Mumbai Property Guide 2026: Prices by Node, Airport Impact, Rents, Costs and Buying Checklist
"Navi Mumbai now has its own international airport and a sea bridge to south Mumbai."
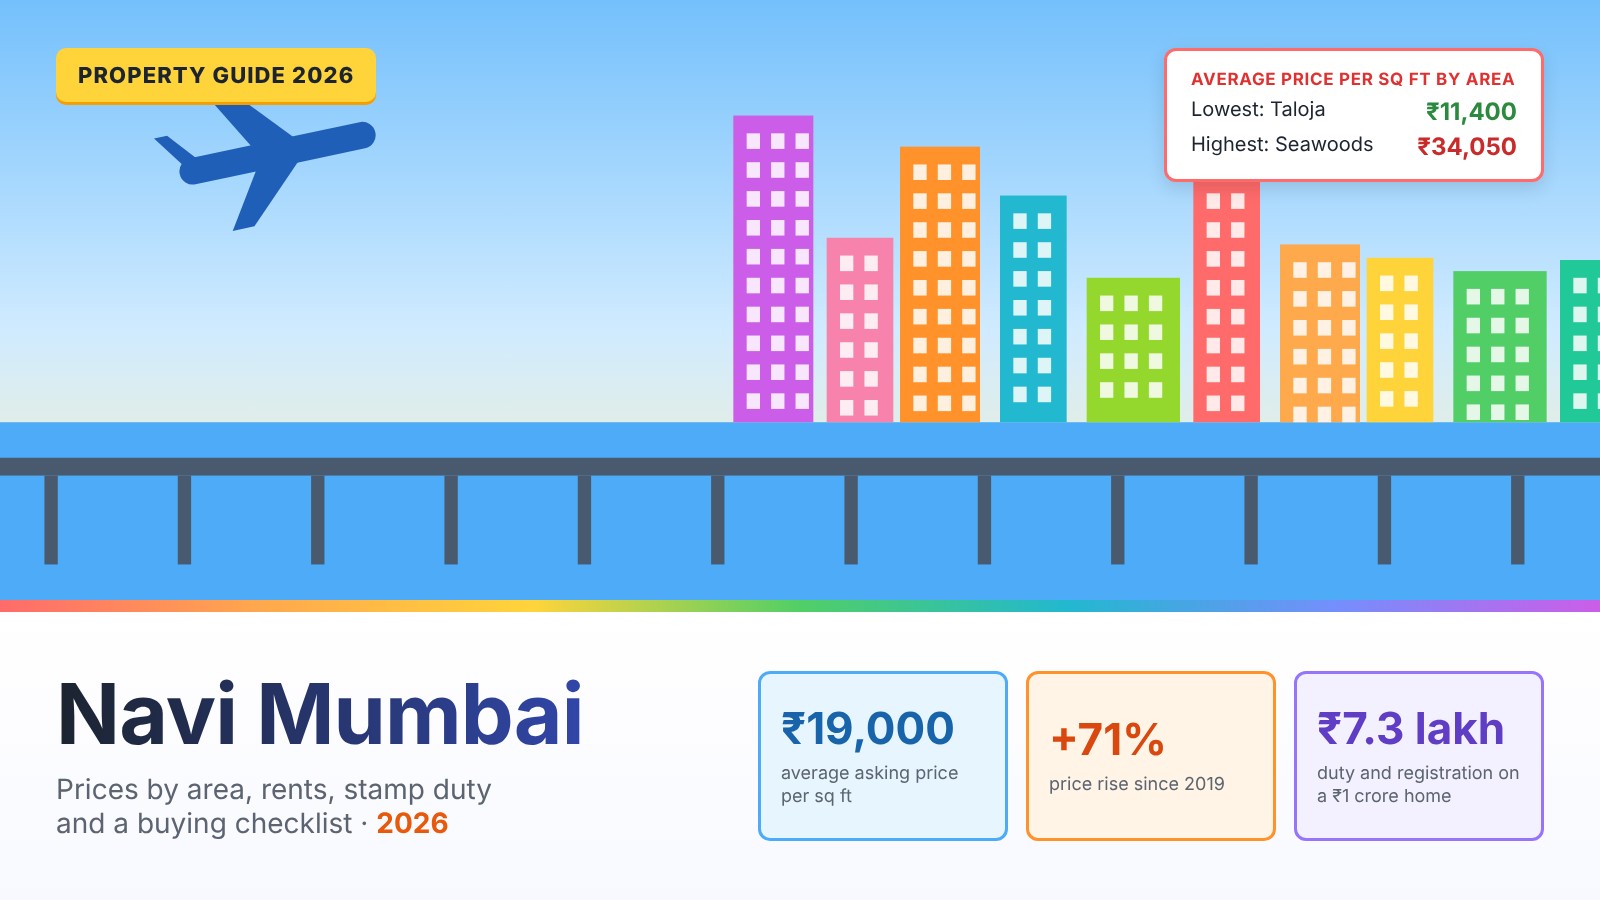
Short answer: Flats in Navi Mumbai cost about ₹19,000 per sq ft on average in 2026, from about ₹11,400 in Taloja to ₹34,050 in Seawoods. Prices are up 71% since 2019, and demand is strong after the opening of the Atal Setu in 2024 and the Navi Mumbai International Airport in December 2025: sales rose 20% in the first half of 2026. Rents return about 2% to 3% of the price a year. Stamp duty is 7% for men and 6% for women.
Key takeaways
- Flats average about ₹19,000 per sq ft, from ₹11,400 in Taloja to ₹34,050 in Seawoods.
- Prices are up 71% since 2019.
- The Atal Setu (2024) and the new international airport (December 2025) lifted demand; sales rose 20% in the first half of 2026.
- Rents return only about 2% to 3% of the price a year.
- Stamp duty is 7% for men and 6% for women, plus registration capped at ₹30,000.
Navi Mumbai property at a glance
| Measure | Figure | Source |
|---|---|---|
| Average asking price | ₹19,000 per sq ft | Square Yards, 2026 |
| Average price, new projects | ₹11,720 per sq ft | ANAROCK, Q2 2026 |
| Price change since 2019 | +71% | ANAROCK |
| 2 BHK rent | ₹25,000 to ₹45,000 a month | Housewise India Rent Index 2026 |
| Gross rental yield | About 2.2% to 3.1% by node; 3.6% (ANAROCK) | Calculated from Square Yards; ANAROCK Q2 2026 |
| Homes sold, H1 2026 | About 17,300, up 20% | NAR–CRE Matrix (Navi Mumbai and Raigad) |
| Share of Mumbai-area sales | 34.5%, the largest submarket | JLL, Q1 2026 |
| Stamp duty | 7% men, 6% women | Maharashtra rates, including metro cess |
| Airport | Commercial flights since 25 December 2025 | All India Radio |
At about ₹19,000 per sq ft, Navi Mumbai is the second most expensive of the 13 cities in our guides, at about 50% of Mumbai’s average.
Map of nodes
Navi Mumbai was planned by CIDCO from the 1970s as a series of self-contained "nodes" across Thane Creek from Mumbai. The older nodes run north to south along the Thane–Belapur road and the harbour rail line: Airoli, Ghansoli, Kopar Khairane, Vashi, Sanpada, Nerul, Seawoods and CBD Belapur. Newer nodes spread east and south: Kharghar, Taloja, Kamothe, Kalamboli, Panvel and Ulwe, the last next to the new airport.
Property prices by node
In short: flats in Navi Mumbai average about ₹19,000 per sq ft. Of the areas in this guide, Taloja (₹11,400) and Kalamboli (₹13,200) are the cheapest, and Seawoods (₹34,050) and Vashi (₹30,750) the most expensive.
Select a column heading to sort. Enter a budget to see how much floor area it buys in each node at the average asking price.
| Local authority | ||||||
|---|---|---|---|---|---|---|
| Seawoods | ₹34,050 | −2.0% | n/a | n/a | NMMC | |
| Vashi | ₹30,750 | −7.7% | ₹72 | 2.8% | NMMC | |
| Nerul | ₹29,850 | −7.6% | ₹76 | 3.1% | NMMC | |
| Ghansoli | ₹24,650 | −11.6% | ₹52 | 2.5% | NMMC | |
| Airoli | ₹23,500 | −1.5% | ₹53 | 2.7% | NMMC | |
| Kopar Khairane | ₹21,500 | +1.6% | n/a | n/a | NMMC | |
| CBD Belapur | ₹19,350 | −2.9% | n/a | n/a | NMMC | |
| Kharghar | ₹19,150 | +3.6% | ₹47 | 2.9% | Panvel MC | |
| Ulwe | ₹17,700 | +13.4% | ₹34 | 2.3% | CIDCO | |
| Panvel | ₹15,450 | +2.5% | ₹34 | 2.6% | Panvel MC | |
| Kamothe | ₹14,650 | +3.0% | ₹27 | 2.2% | Panvel MC | |
| Kalamboli | ₹13,200 | −2.1% | n/a | n/a | Panvel MC | |
| Taloja | ₹11,400 | −9.5% | ₹22 | 2.3% | Panvel MC |
Source: Square Yards node pages, June to September 2026. Prices and rents are averages of listed asking prices for apartments. Square Yards labels the recent change inconsistently as quarterly or yearly. Implied yield = rent × 12 ÷ price. Maharashtra prices are usually quoted on carpet area. "n/a" means no consistent rent figure was published.
Best nodes by budget
| Budget | Where to look | Typical size at average prices |
|---|---|---|
| Under ₹1 crore | Taloja, Kalamboli, Kamothe, Panvel | About 650 to 880 sq ft: a 1 or 2 BHK |
| ₹1 crore to ₹2 crore | Ulwe, Kharghar, CBD Belapur, Panvel, Kamothe | About 560 to 1,370 sq ft: a 2 or 3 BHK |
| ₹2 crore to ₹3 crore | Airoli, Ghansoli, Kopar Khairane, Kharghar | About 810 to 1,570 sq ft |
| Above ₹3 crore | Vashi, Nerul, Seawoods | About 880 to 1,000 sq ft at ₹3 crore |
Calculated from Square Yards average asking prices, 2026. Sizes are carpet area. Use the budget column in Table 2 for any amount.
Prices vary by sector, not just by node
A node average can hide a wide range. In Kharghar, sector averages run from about ₹11,750 to ₹25,900 per sq ft, depending on age, views and distance from the station and Central Park. Seawoods ranges from ₹28,500 to ₹40,650. Always compare flats within the same sector.
| Node | Sector | Price per sq ft |
|---|---|---|
| Seawoods | Sector 58 | ₹40,650 |
| Sector 50 | ₹31,800 | |
| Sector 38 | ₹30,400 | |
| Sector 36 | ₹29,350 | |
| Sector 42 | ₹28,500 | |
| Nerul | Sector 27 | ₹31,100 |
| Sector 19A | ₹29,250 | |
| Sector 46A | ₹27,750 | |
| Sector 21 | ₹25,150 | |
| Sector 17 | ₹22,950 | |
| Sanpada | Sector 11 | ₹31,350 |
| Sector 8 | ₹28,650 | |
| Vashi | Sector 29 | ₹27,800 |
| Airoli | Sector 14 | ₹30,850 |
| CBD Belapur | Sector 15 | ₹27,200 |
| Kopar Khairane | Sector 11 | ₹25,000 |
| Sector 3 | ₹20,800 | |
| Sector 20 | ₹20,300 | |
| Kharghar | Sector 6 | ₹25,900 |
| Sector 12 | ₹22,600 | |
| Sector 11 | ₹22,000 | |
| Sector 19 | ₹20,550 | |
| Sector 20 | ₹18,700 | |
| Sector 39 | ₹16,250 | |
| Sector 10 | ₹15,900 | |
| Sector 34 | ₹15,150 | |
| Sector 13 | ₹13,350 | |
| Sector 21 | ₹11,750 | |
| Kamothe | Sector 21 | ₹16,900 |
| Sector 35 | ₹15,850 | |
| Sector 36 | ₹15,650 | |
| Sector 34 | ₹14,100 | |
| Sector 22 | ₹13,900 | |
| Taloja | Sector 23 | ₹12,800 |
| Sector 2 | ₹8,000 |
Source: Square Yards locality pages, 2026. Sector averages rest on fewer listings than node averages and can move sharply between updates.
Price trends
Navi Mumbai's prices rose a little faster than Mumbai's and Thane's between 2019 and 2026, and it remains the cheapest of the three by a wide margin. ANAROCK's figures track new projects; Square Yards' higher average of ₹19,000 includes resale flats in expensive older nodes such as Vashi and Nerul.
Recent movement is mixed. On Square Yards' latest figures, prices in the established nodes (Vashi, Nerul, Ghansoli, Seawoods) slipped, while Ulwe, Kharghar, Kamothe and Panvel rose. Across JLL's Mumbai market, capital values rose 6.5% in the year to March 2026.
The airport effect
Prices around the airport moved well before it opened. Panvel's average quoted price roughly doubled between 2019 and 2026, and ANAROCK recorded a 76% rise over five years in a separate land study. Ulwe showed the largest recent rise of the nodes covered here, about 13%. Since flights began, growth in Panvel has slowed to about 1% a quarter. A buyer today is paying for an airport that already exists.
Node guide
Seawoods
₹34,050 per sq ft. Next to Nerul with a large mall and station complex; among the costliest nodes. Suits: buyers wanting a prime, ready address.
Vashi
₹30,750 per sq ft · rent about ₹72 per sq ft a month · implied yield 2.8%. The oldest and best-connected node, next to the Vashi bridge to Mumbai. Suits: buyers commuting to Mumbai by road or rail.
Nerul
₹29,850 per sq ft · rent about ₹76 per sq ft a month · implied yield 3.1%. Established node with schools, colleges and the Harbour and Trans-Harbour rail lines. Suits: families wanting a settled neighbourhood.
Ghansoli
₹24,650 per sq ft · rent about ₹52 per sq ft a month · implied yield 2.5%. On the Thane–Belapur corridor near the Ghansoli IT and business parks. Suits: buyers working in the Thane–Belapur office belt.
Airoli
₹23,500 per sq ft · rent about ₹53 per sq ft a month · implied yield 2.7%. Northern gateway near Thane, with IT parks and the Airoli bridge to Mulund. Suits: buyers working in Thane or the eastern suburbs.
Kopar Khairane
₹21,500 per sq ft. Older residential node between Vashi and Ghansoli. Suits: value buyers wanting central Navi Mumbai.
CBD Belapur
₹19,350 per sq ft. Administrative centre with CIDCO's offices and the start of Metro Line 1. Suits: buyers wanting metro access and offices nearby.
Kharghar
₹19,150 per sq ft · rent about ₹47 per sq ft a month · implied yield 2.9%. Planned node with Central Park, golf course and Metro Line 1. Suits: families wanting newer planned sectors.
Ulwe
₹17,700 per sq ft · rent about ₹34 per sq ft a month · implied yield 2.3%. Next to the new airport and the Atal Setu landing. Suits: buyers betting on the airport.
Panvel
₹15,450 per sq ft · rent about ₹34 per sq ft a month · implied yield 2.6%. Rail and highway junction south-east of the city, close to the airport. Suits: budget buyers, Pune–Mumbai commuters.
Kamothe
₹14,650 per sq ft · rent about ₹27 per sq ft a month · implied yield 2.2%. Dense residential node between Kharghar and Kalamboli. Suits: first-time buyers.
Kalamboli
₹13,200 per sq ft. Near the Mumbai–Pune Expressway and JNPT road. Suits: buyers needing highway access.
Taloja
₹11,400 per sq ft · rent about ₹22 per sq ft a month · implied yield 2.3%. Industrial area with newer housing at the end of Metro Line 1. Suits: budget buyers and long-term investors.
Prices and rents: Square Yards, 2026. Descriptions are general; check individual projects and sectors.
Which node suits which buyer
| If you want | Look at | Why |
|---|---|---|
| The quickest commute to Mumbai | Vashi, Sanpada, Nerul | Vashi bridge and harbour rail line |
| Office jobs in Thane–Belapur | Airoli, Ghansoli, Kopar Khairane | Next to the IT and business parks |
| Metro access and planned sectors | CBD Belapur, Kharghar | On Metro Line 1 |
| The airport and Atal Setu | Ulwe, Panvel | Closest to both |
| The lowest price | Taloja, Kalamboli, Kamothe | ₹11,400 to ₹14,650 per sq ft |
| The best rent for the price | Nerul, Kharghar, Vashi | Implied yields of 2.8% to 3.1% |
| Recent price momentum | Ulwe, Kharghar, Kamothe | Largest recent rises on Square Yards' figures |
A reading of the figures on this page, and not a recommendation.
Rents and rental yield
In short: A 2 BHK rents for ₹25,000 to ₹45,000 a month. Gross yields are low, 2.2% to 3.1% across the main nodes.
A 2 BHK in Navi Mumbai rents for ₹25,000 to ₹45,000 a month, and rents rose 10% to 14% in the year to mid-2026, according to Housewise. Magicbricks recorded a 19.4% annual rise in Navi Mumbai rents in mid-2025, the fastest among the cities it tracked.
Yields are low everywhere: 2.2% to 3.1% across the nine nodes with consistent rent data. Established nodes such as Nerul and Vashi return a little more than newer ones such as Ulwe and Taloja, where many flats are still empty or newly occupied. ANAROCK's citywide figure is 3.6%.
EMI or rent?
| Flat price | Down payment (20%) | Stamp duty (man, 7%) | Monthly EMI | Typical monthly rent | EMI ÷ rent |
|---|---|---|---|---|---|
| ₹1 crore | ₹20 lakh | ₹7 lakh | ₹66,900 | ₹25,000 | 2.7× |
| ₹1.5 crore | ₹30 lakh | ₹10.5 lakh | ₹1,00,400 | ₹37,500 | 2.7× |
| ₹3 crore | ₹60 lakh | ₹21 lakh | ₹2,00,700 | ₹75,000 | 2.7× |
EMI on an 80% loan for 20 years at 8%, roughly where home loan rates sit after the October 2026 repo rate increase. Rent assumes a 3% gross yield.
Owning costs about 2.7 times as much each month as renting the same flat, before maintenance and the cash tied up in the down payment and stamp duty.
Each half-point rise in the interest rate adds about ₹4,689 a month to the EMI on this loan, so compare lenders and ask how your rate is linked to the repo rate.
Sales and demand
Navi Mumbai is the growth engine of the Mumbai region. In the first half of 2026, homes sold in Navi Mumbai and Raigad rose 20% to about 17,300, while sales in Mumbai city were broadly flat. The average ticket was ₹71 lakh, against ₹2.38 crore in Mumbai city.
Supply is rising even faster than sales. Launches in Navi Mumbai and Raigad rose 29% to about 25,800 homes in H1 2026, more than were sold. Across the Mumbai region, ANAROCK counts about 18 months of unsold stock.
Navi Mumbai vs. Mumbai vs. Thane
| Measure | Navi Mumbai | Mumbai | Thane | Source |
|---|---|---|---|---|
| Average price, Q2 2026 | ₹11,720 | ₹29,270 | ₹14,300 | ANAROCK |
| Price change, 2019 to 2026 | +71% | +64% | +63% | ANAROCK |
| Gross rental yield, Q2 2026 | 3.6% | 4.3% | 3.5% | ANAROCK |
| 2 BHK rent per month | ₹25,000 to ₹45,000 | ₹55,000 to ₹90,000 | ₹25,000 to ₹45,000 | Housewise |
| Stamp duty, man | 7% | 6% | 7% | Maharashtra rates |
Mumbai's stamp duty is 5% plus 1% metro cess. Thane and Navi Mumbai rates include a further 1% local body tax where it applies. Confirm the rate for the specific location.
Infrastructure
- Navi Mumbai International Airport. Began commercial flights on 25 December 2025, with an IndiGo flight from Bengaluru. It sits next to Ulwe and Panvel and gives the Mumbai region a second airport.
- Atal Setu (Mumbai Trans Harbour Link). Opened in January 2024, the sea bridge links Sewri in south Mumbai to Chirle near Ulwe, cutting the drive between south Mumbai and Navi Mumbai.
- Navi Mumbai Metro Line 1. An 11 km line with 11 stations from CBD Belapur through Kharghar to Taloja and Pendhar, open since November 2023. Planned extensions run to Kalamboli and Khandeshwar and on to the airport.
- Rail and road. The Harbour and Trans-Harbour suburban lines serve the older nodes, and the Sion–Panvel Highway and Mumbai–Pune Expressway pass through the south.
The biggest projects are already open and largely reflected in prices. The metro extensions are the main remaining catalyst, mainly for Kalamboli, Khandeshwar and Ulwe.
CIDCO, NMMC and Panvel: who runs what
Navi Mumbai has several authorities, and which one applies affects approvals, taxes and transfers.
- CIDCO (City and Industrial Development Corporation of Maharashtra) planned the city and still owns much of the land, leased to buyers and developers. It is also the planning authority for newer areas such as Ulwe and Dronagiri.
- NMMC (Navi Mumbai Municipal Corporation) runs the older nodes from Airoli to CBD Belapur and collects property tax there.
- Panvel Municipal Corporation covers Kharghar, Kamothe, Kalamboli, Taloja and Panvel.
On CIDCO leasehold land, resale may need CIDCO's transfer permission and a transfer fee. Ask the seller for the lease deed and CIDCO transfer papers, and confirm which authority collects property tax.
Stamp duty and buying costs
In short: on a ₹1 crore home, stamp duty and registration come to about ₹7.3 lakh for a man and ₹6.3 lakh for a woman buying alone, in the middle of the 13 cities in our guides.
| Component | Man or joint with a man | Woman, or only women |
|---|---|---|
| Base stamp duty | 5% | 4% |
| Metro cess | 1% | 1% |
| Local body tax | 1% | 1% |
| Total | 7% | 6% |
| Registration | 1%, capped at ₹30,000 | 1%, capped at ₹30,000 |
Charged on the higher of the agreement value and the ready reckoner rate. Source: Square Yards, August 2026. Some sources say the local body tax does not apply in NMMC areas, which would make the rate 6% for men; confirm with the sub-registrar for your node.
Ready reckoner rate vs. market price
| Node | Average asking price | Registration rate | Asking ÷ registration |
|---|---|---|---|
| Vashi | ₹30,750 | ₹18,950 | 1.62× |
| Airoli | ₹23,500 | ₹17,450 | 1.35× |
| Panvel | ₹15,450 | ₹11,750 | 1.31× |
| Taloja | ₹11,400 | ₹9,900 | 1.15× |
Stamp duty is charged on whichever is higher: the price you pay or the ready reckoner value. In Navi Mumbai, market prices sit 15% to 60% above the registration rate, so most buyers pay duty on the agreement price. The gap is widest in established nodes such as Vashi. Look up the exact rate on the IGR Maharashtra website.
| Cost | Typical amount | Notes |
|---|---|---|
| GST | 5% of price | Under-construction homes only; 1% for homes that qualify as affordable |
| Brokerage | About 1% | Mainly on resale; negotiable |
| CIDCO transfer charges | Varies | On resale of leasehold property |
| Society transfer and maintenance | Varies | Ask for the full schedule |
| Property tax | Annual | Paid to NMMC or Panvel Municipal Corporation |
Banks lend against the property price, so stamp duty, registration and GST usually have to come from your own savings on top of the down payment. Plan for about ₹28 lakh to ₹32 lakh in cash for every ₹1 crore of property.
Buying cost calculator
Stamp duty on the price entered; if the ready reckoner value is higher, duty is charged on that. Excludes CIDCO transfer charges, maintenance, interiors and loan fees. An estimate, and not legal or tax advice.
Buyer's checklist
- Check MahaRERA registration. Search the project on the MahaRERA website and read its approvals, timelines and complaints.
- Check building approvals. Confirm plan approval from CIDCO or the municipal corporation for the node.
- Ask for the occupancy certificate. For a ready flat, do not pay in full without it.
- Verify the title and lease. Have a lawyer check the title chain and any CIDCO lease conditions.
- Look up the ready reckoner rate. It sets the minimum value for stamp duty; check it on the IGR Maharashtra website.
- Check transfer charges and dues. Confirm CIDCO and society transfer charges, property tax and maintenance dues.
- Visit at rush hour and in the monsoon. Traffic, drainage and water supply vary between sectors.
- Budget for everything. Use the calculator above, then add interiors and moving costs.
Ready vs. under construction
| Factor | Ready to move | Under construction |
|---|---|---|
| GST | None | 5% (1% if affordable) |
| Choice | Mostly resale in older nodes | Most new supply, in Ulwe, Panvel, Kharghar and Taloja |
| Risk | What you see is what you get | Delivery delays and changes |
| Rent or move in | Immediately | After possession, often three to five years |
Outlook for 2026 and 2027
- Demand is strong. Sales in Navi Mumbai and Raigad rose 20% in H1 2026, and the city leads the Mumbai market on sales and launches.
- Supply is stronger. Launches rose 29%, outpacing sales, which should cap price growth.
- The big projects are open. The airport, Atal Setu and Metro Line 1 are already working, so the next gains depend on jobs and the airport's growth rather than on new announcements.
- Loans are dearer. The RBI raised the repo rate to 5.50% in October 2026.
The data points to steady demand with moderate price growth. No reliable price forecast has been published.
Risks
- Oversupply in new nodes. Heavy launches in Ulwe, Panvel and Taloja may leave many flats empty for years.
- Low yields. Rents of 2% to 3% leave little cushion if prices stall.
- Leasehold paperwork. CIDCO lease and transfer rules add cost and time to resales.
- Airport noise. Homes under flight paths near Ulwe and Panvel may be affected as traffic grows.
- Industrial areas. Parts of Taloja sit close to industrial estates; check air quality and surroundings.
Glossary
- Node
- A planned township within Navi Mumbai, such as Vashi or Kharghar, divided into numbered sectors.
- CIDCO
- The City and Industrial Development Corporation of Maharashtra, which planned Navi Mumbai and leases much of its land.
- NMMC
- Navi Mumbai Municipal Corporation, the civic body for the older nodes.
- Ready reckoner rate
- The government's minimum property value per square metre for a location, used for stamp duty.
- MahaRERA
- The Maharashtra Real Estate Regulatory Authority, where new projects must be registered.
- Atal Setu
- The Mumbai Trans Harbour Link, a sea bridge from Sewri to Chirle near Ulwe.
- Carpet area
- The usable floor area inside a flat's walls. Maharashtra prices are usually quoted on carpet area.
Frequently asked questions
What is the average property price in Navi Mumbai in 2026?
The average asking price for flats across Navi Mumbai was about ₹19,000 per sq ft in 2026, according to Square Yards listings. ANAROCK's average quoted price for new projects was lower, at ₹11,720 per sq ft in Q2 2026. Prices range from about ₹11,400 in Taloja to ₹34,050 in Seawoods.
Which is the best area to buy in Navi Mumbai?
It depends on budget and commute. Vashi, Nerul and Seawoods are the established, best-connected nodes, at ₹29,000 to ₹34,000 per sq ft. Kharghar and CBD Belapur offer newer planned sectors and Metro Line 1 at about ₹19,000 to ₹19,500. Ulwe is closest to the new airport, and Panvel, Kamothe, Kalamboli and Taloja are the main options below ₹16,000.
How much have Navi Mumbai property prices risen?
ANAROCK's average for Navi Mumbai rose 71% between 2019 and Q2 2026, from ₹6,860 to ₹11,720 per sq ft, slightly more than Mumbai (64%) and Thane (63%). Panvel's average quoted price rose about 101% over the same period.
Has the new airport raised property prices in Ulwe and Panvel?
Ulwe showed the biggest recent price rise of the nodes covered here, about 13% on Square Yards' latest figures, and Panvel's prices have roughly doubled since 2019. Navi Mumbai International Airport began commercial flights on 25 December 2025. Much of the expected airport effect was priced in before it opened.
What is the stamp duty in Navi Mumbai?
Stamp duty is 7% for men and 6% for women buying alone or only with other women, made up of the base duty plus a 1% metro cess and a 1% local body tax. Some sources say the local body tax does not apply in NMMC areas, so confirm the rate for your node. Registration is 1% of the value, capped at ₹30,000.
What is the rental yield in Navi Mumbai?
Based on 2026 asking rents and prices, gross rental yields are 2.2% to 3.1% in most nodes, from about 2.2% in Kamothe to 3.1% in Nerul. ANAROCK puts the Navi Mumbai average at 3.6% for Q2 2026. Either way, yields are well below home loan rates.
Is Navi Mumbai a good place to invest in 2026?
Demand is strong: sales in Navi Mumbai and Raigad rose 20% in H1 2026 while Mumbai's were flat, and Navi Mumbai had the largest share of sales and launches in JLL's Mumbai market. But launches rose 29%, rents return only 2% to 3%, and loan rates rose in October 2026. It suits buyers who can hold for many years.
What is CIDCO and why does it matter when buying in Navi Mumbai?
CIDCO, the City and Industrial Development Corporation of Maharashtra, planned Navi Mumbai and still owns much of its land on long leases. Many flats sit on CIDCO leasehold land, and resales may need CIDCO's transfer permission and fees. Check the lease terms and transfer charges before you buy.
Navi Mumbai or Thane: which is better?
Both cost far less than Mumbai. ANAROCK puts Thane's average at ₹14,300 per sq ft and Navi Mumbai's at ₹11,720 in Q2 2026, and rents are similar at ₹25,000 to ₹45,000 for a 2 BHK. Navi Mumbai is more planned and now has the airport and Atal Setu; Thane is closer to the western and central suburbs.
What is the EMI on a ₹1 crore flat in Navi Mumbai?
With a 20% down payment and an ₹80 lakh loan for 20 years at 8%, the EMI is about ₹66,900 a month. A similar flat would rent for about ₹25,000 a month at a 3% yield, so the EMI is about 2.7 times the rent.
What should I check before buying a flat in Navi Mumbai?
Check MahaRERA registration, the CIDCO or NMMC building approvals, and the occupancy certificate for a ready flat. Verify the title and any CIDCO lease conditions, the ready reckoner rate, society transfer charges, and that property tax and maintenance dues are paid.
What is the ready reckoner rate in Navi Mumbai?
The ready reckoner rate is the government's minimum value for a location, used to calculate stamp duty. Square Yards lists registration rates of about ₹18,950 per sq ft in Vashi, ₹17,450 in Airoli, ₹11,750 in Panvel and ₹9,900 in Taloja, well below asking prices. Check the exact rate for your survey number on the IGR Maharashtra website.
Kharghar or Ulwe: which is better?
Kharghar is more established, with Metro Line 1, Central Park and a golf course, at about ₹19,150 per sq ft on average. Ulwe is newer and slightly cheaper at about ₹17,700, and sits next to the airport and the Atal Setu landing. Ulwe's prices have risen faster recently, but its yields are lower and much of it is still being built.
Related guides
How we compiled this guide
- Area prices are average asking prices for apartments from Square Yards' area pages, checked between June and October 2026. Asking prices are what sellers list, not final sale prices, and they move as listings change.
- City-wide trends, sales and supply come from research firms such as ANAROCK, Knight Frank, PropEquity, JLL and Crisil, as labelled under each chart. Each firm tracks different projects and periods, so we show their figures side by side rather than combining them.
- Calculated figures, such as floor area for a budget, EMIs (80% loan, 20 years, 8%), rent at a stated yield and buying costs, are our own arithmetic from those sources.
- Stamp duty and registration rates are taken from state rules as reported by the sources listed. Confirm the exact amount with the sub-registrar before you pay.
- Dates. This guide was published on 10 October 2026 and updated on 12 October 2026. We plan to review it in January 2027.
Sources and resources
- Square Yards: Navi Mumbai property rates and node pages for Kharghar, Ulwe, Nerul, Taloja, Kamothe and Ghansoli
- ANAROCK: prices and yields since 2019 (Upstox), MMR Residential Market Viewpoints, Q2 2026, Q2 2025, micro-market study (Business Standard), Panvel land study (Free Press Journal)
- NAR–CRE Matrix India Housing Report, September 2026 (Business Today)
- JLL: Navi Mumbai leads sales and launches, Q1 2026 (Real Estate Asia)
- Housewise India Rent Index 2026 and Magicbricks Rental Index (Business Standard)
- Stamp duty and registration in Navi Mumbai (Square Yards)
- Navi Mumbai International Airport starts commercial flights (All India Radio)
- Navi Mumbai Metro (Wikipedia)
- Official portals: MahaRERA, IGR Maharashtra (ready reckoner rates and registration), CIDCO, Navi Mumbai Municipal Corporation, Panvel Municipal Corporation
This page is general information, and not financial, legal or tax advice. Figures are averages from the sources listed and will differ for individual properties.