Property Guide Oct 28, 2026 • 44 min read • 181 views

Mumbai Property Guide 2026: Prices by Area, Metro and Coastal Road Impact, Rents, Costs and Buying Checklist
BI
BigIndia Editorial BigIndia Research & Editorial
Mumbai Property Guide 2026: Prices by Area, Metro and Coastal Road Impact, Rents, Costs and Buying Checklist

"Mumbai is India's most expensive and largest housing market by value."

Mumbai Property Guide 2026: Prices, Areas, Rents & Costs

Updated 12 October 2026 · Covers Mumbai city, with comparisons to Thane and Navi Mumbai · Reading time: 13 minutes

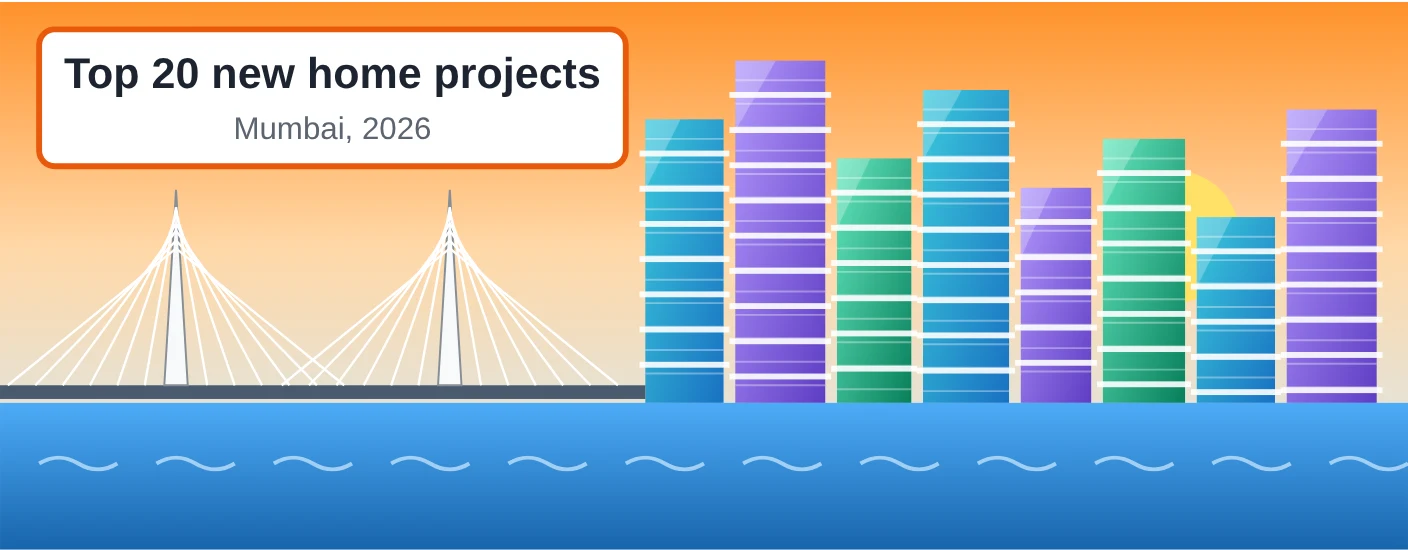
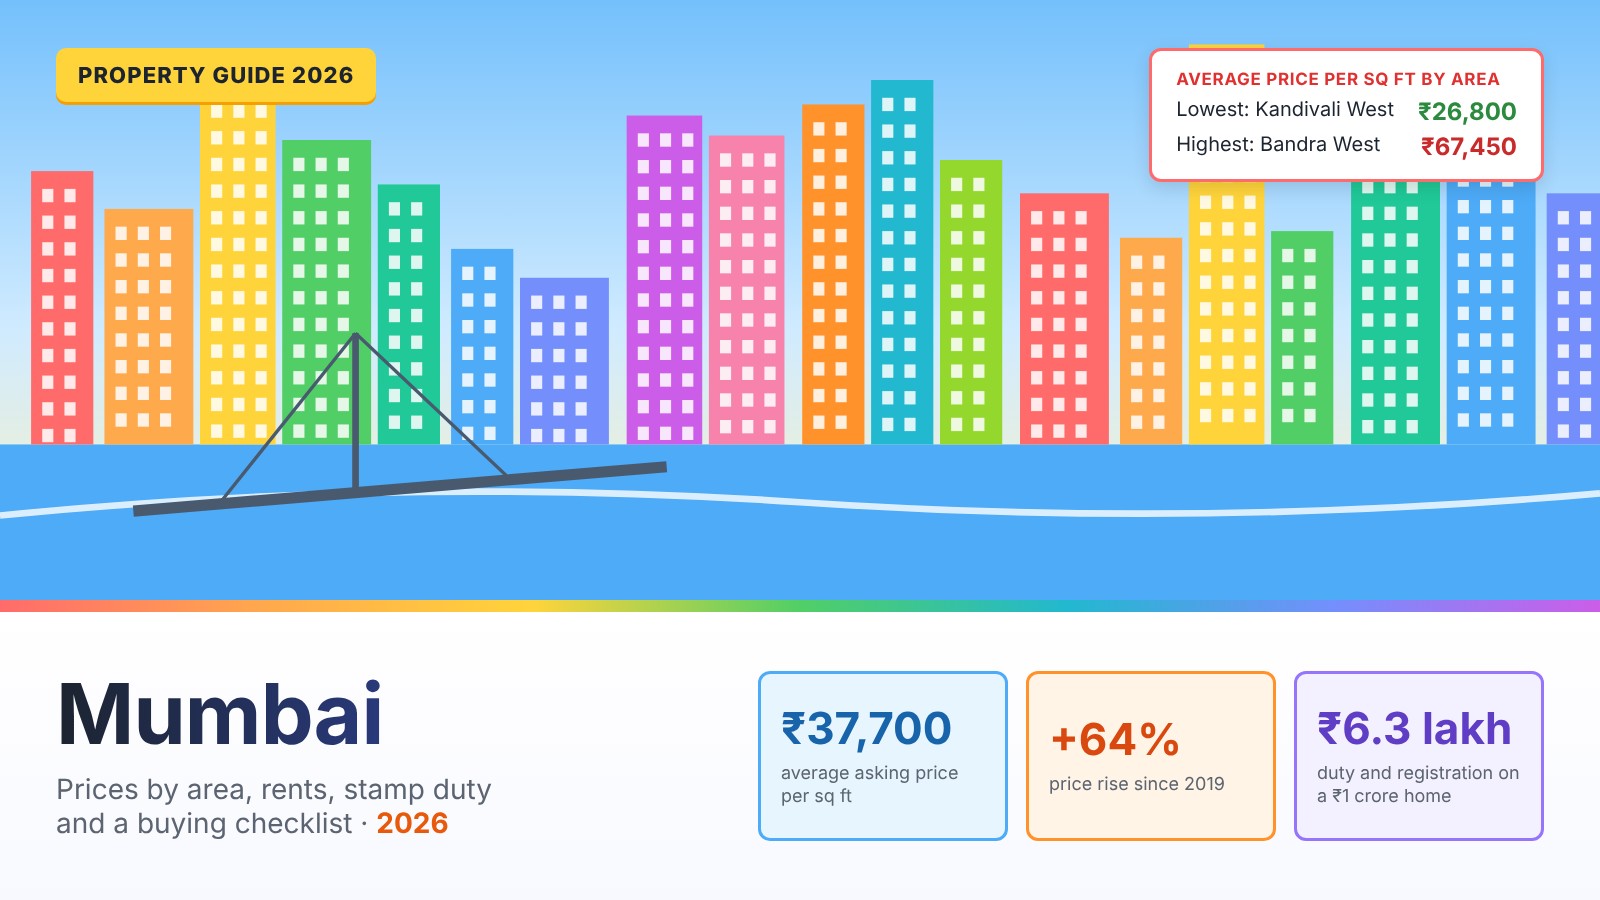
Illustration of the Mumbai skyline along the sea with a cable-stayed sea bridgeDense high-rise towers along the waterfront with a cable-stayed sea bridge in the foreground, and a sign reading Mumbai property guide 2026.MumbaiProperty guide, 2026
Mumbai is India's most expensive and largest housing market by value.

Short answer: Flats in Mumbai cost about ₹37,700 per sq ft on average in 2026, from about ₹26,800 in Dahisar and Kandivali to over ₹66,000 in Worli and Bandra West. Prices are up 64% since 2019 and still rising 4% to 6% a year. Demand is steady: registrations hit a 14-year September high in 2026, and buyers are moving to bigger, costlier homes. Rents return about 3% to 5% a year. Stamp duty is 6% for men and 5% for women, plus registration of up to ₹30,000.

Key takeaways

  • Flats average about ₹37,700 per sq ft, from ₹26,800 in Dahisar and Kandivali to ₹67,450 in Bandra West.
  • Prices are up 64% since 2019 and rising 4% to 6% a year.
  • Registrations hit 12,622 in September 2026, the highest for that month in 14 years.
  • A 2 BHK rents for ₹55,000 to ₹90,000 a month; gross yields average about 3.6%.
  • Stamp duty is 6% for men and 5% for women, plus registration capped at ₹30,000.

Mumbai property at a glance

Four key figures for Mumbai property in 2026Four panels: average asking price 37,700 rupees per square foot; 12,622 property registrations in September 2026, a 14-year high for the month; gross rental yield of about 3.6 percent; stamp duty of 6 percent for men and 5 percent for women.₹37,700Average asking price persq ftSquare Yards, Sep 202612,622Registrations inSeptember 202614-year high for September~3.6%Gross rental yieldSquare Yards6% / 5%Stamp duty, men / womenPlus 1% registration (cap ₹30,000)
Figure 1. Mumbai property in four numbers. Sources as labelled.
Table 1. Key figures for Mumbai housing, 2026
MeasureFigureSource
Average asking price₹37,700 per sq ftSquare Yards, September 2026
Average price, new projects (Mumbai city)₹29,270 per sq ftANAROCK, Q2 2026
Price change since 2019+64%ANAROCK
Price change, latest year+4% to +6%ANAROCK; Knight Frank
Property registrations, September 202612,622, +5%Knight Frank
Homes sold in MMR, Jan–Sep 202672,804, +1%Knight Frank
Average ticket, Mumbai city, H1 2026₹2.38 croreNAR–CRE Matrix
2 BHK rent₹55,000 to ₹90,000 a monthHousewise India Rent Index 2026
Gross rental yieldAbout 3.6% (Square Yards); 4.3% (ANAROCK)Square Yards; ANAROCK
Stamp duty6% men, 5% womenMaharashtra rates, including metro cess
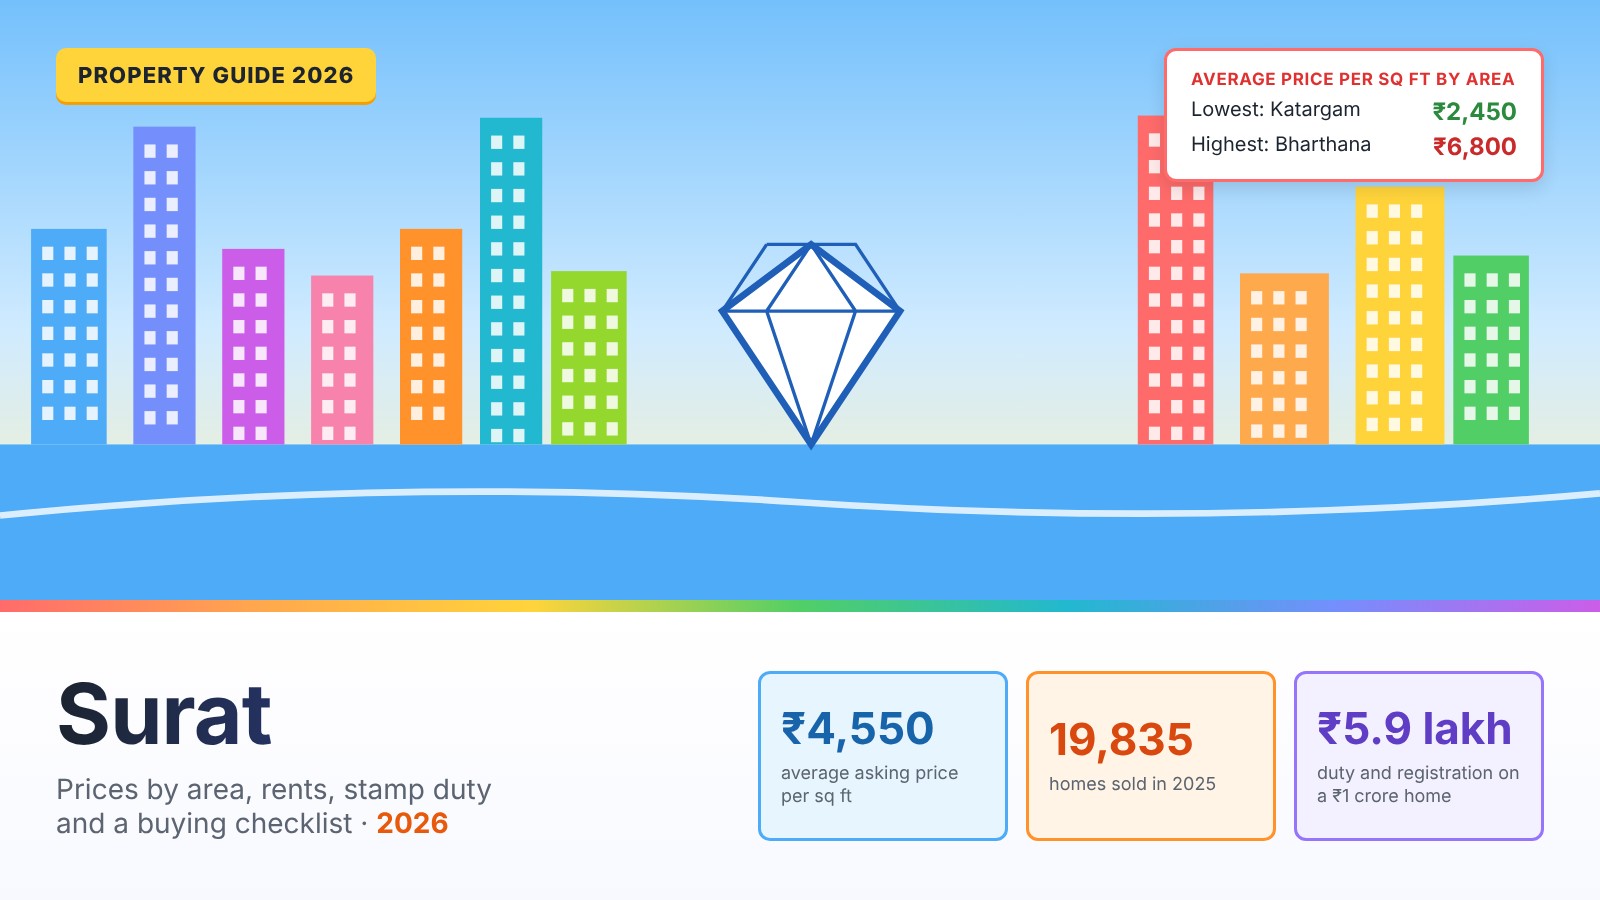
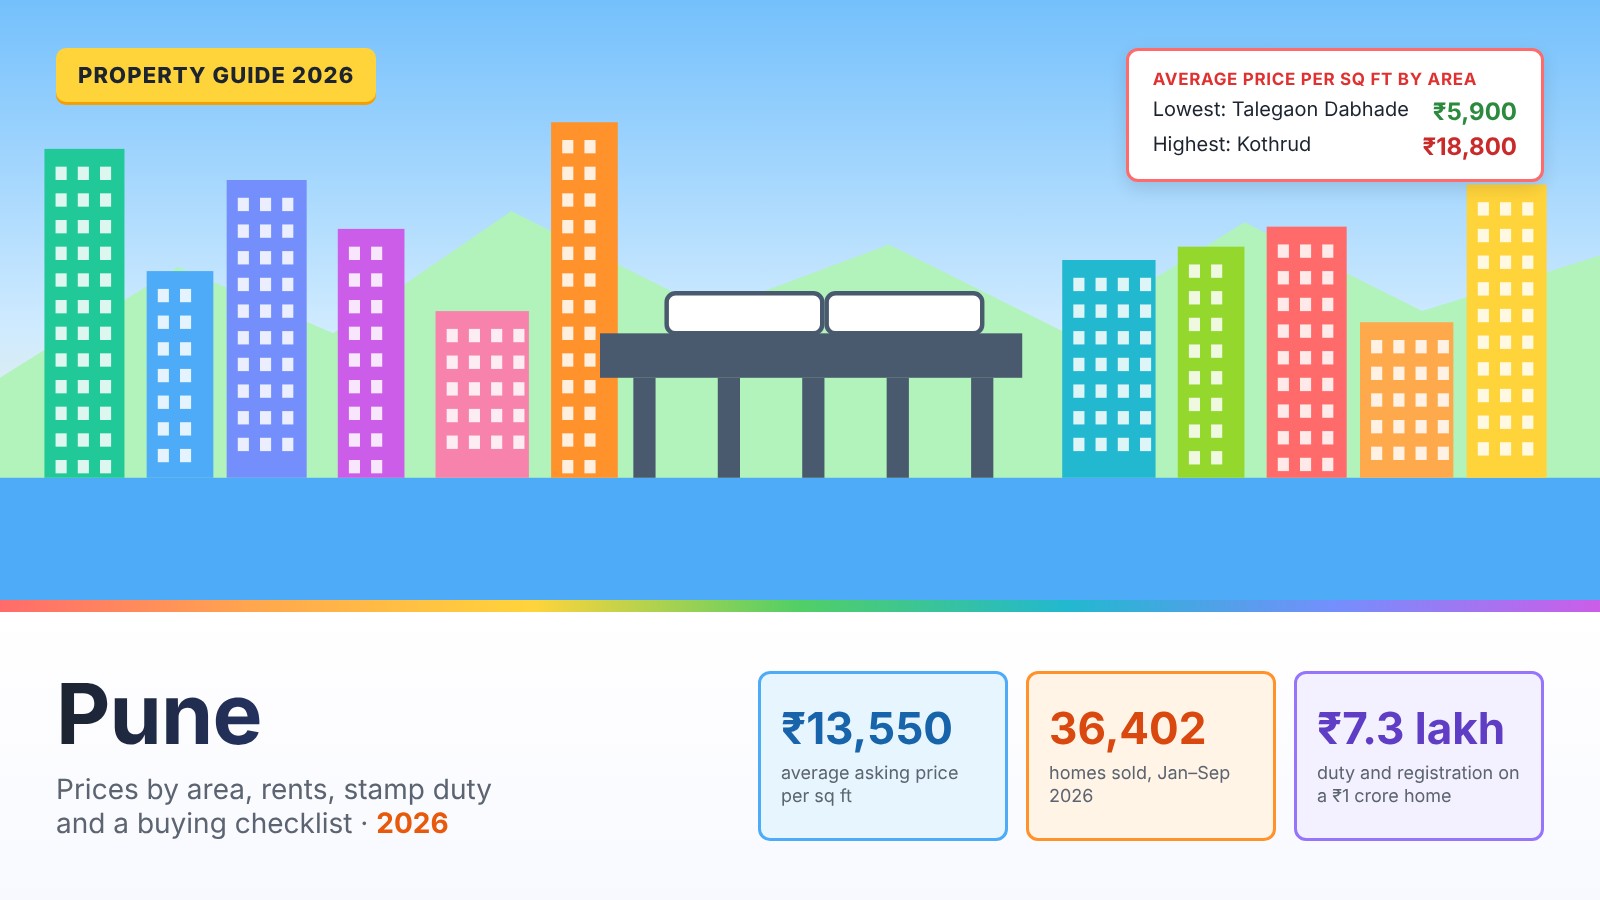
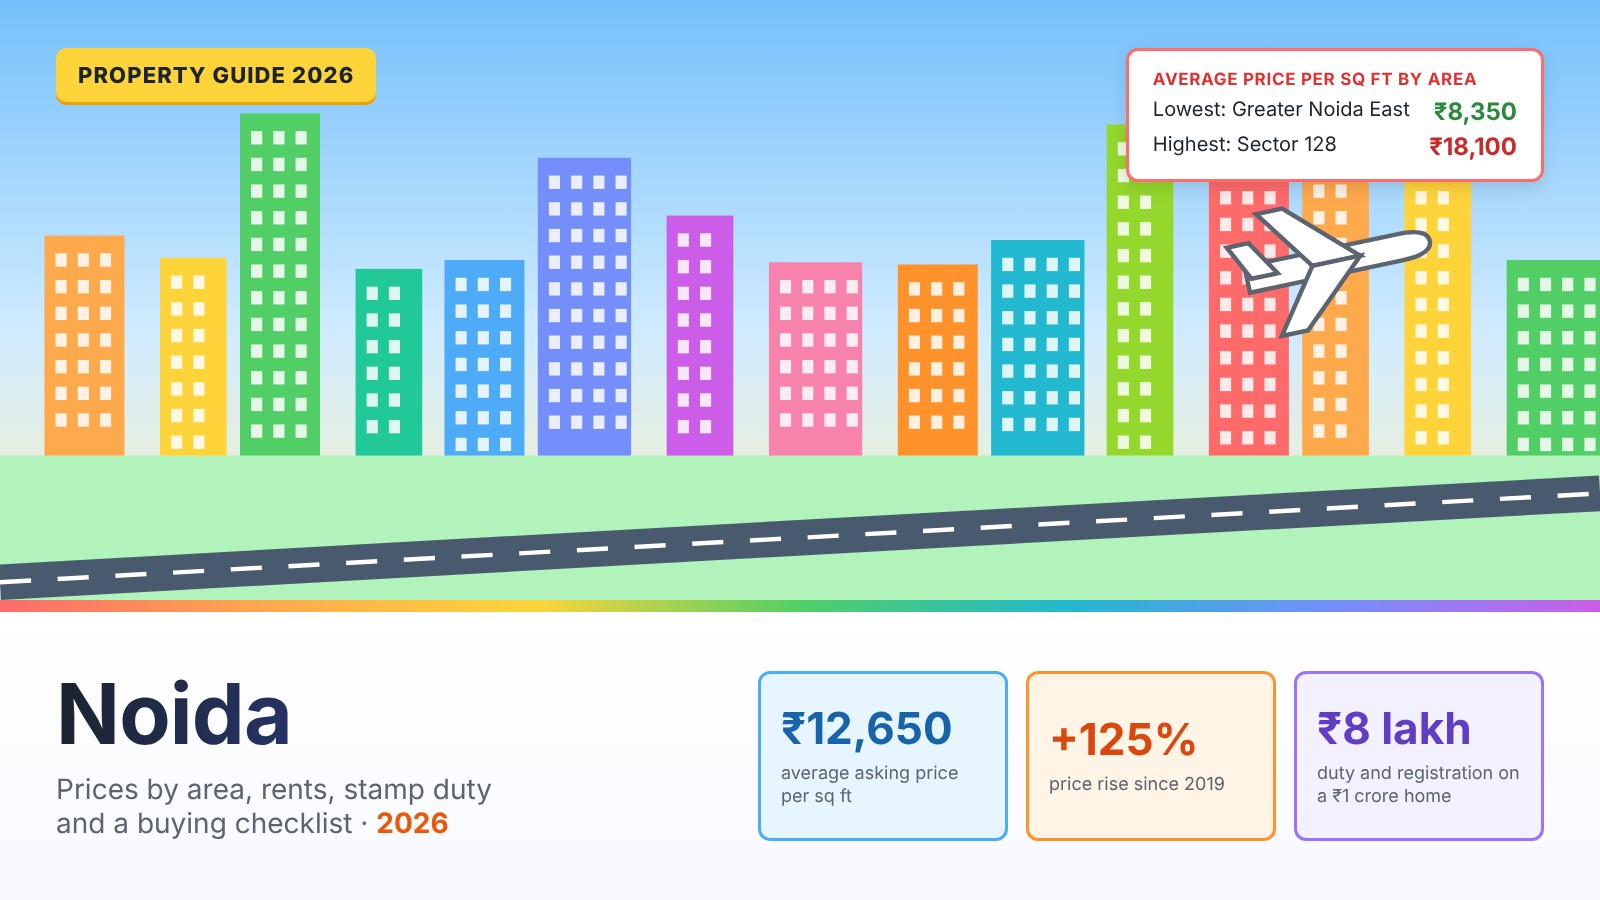
Average asking price per square foot in 13 Indian cities, 2026Bar chart of Square Yards city averages: Mumbai 37,700, Navi Mumbai 19,000, Delhi 18,200, Gurgaon 15,100, Pune 13,550, Noida 12,650, Bangalore 12,400, Hyderabad 9,400, Chennai 9,200, Kolkata 6,800, Ahmedabad 5,900, Jaipur 4,950, Surat 4,550 rupees per square foot. Mumbai is highlighted.0₹10,000₹20,000₹30,000₹40,000Mumbai: ₹37,700Mumbai₹37,700Navi Mumbai: ₹19,000Navi Mumbai₹19,000Delhi: ₹18,200Delhi₹18,200Gurgaon: ₹15,100Gurgaon₹15,100Pune: ₹13,550Pune₹13,550Noida: ₹12,650Noida₹12,650Bangalore: ₹12,400Bangalore₹12,400Hyderabad: ₹9,400Hyderabad₹9,400Chennai: ₹9,200Chennai₹9,200Kolkata: ₹6,800Kolkata₹6,800Ahmedabad: ₹5,900Ahmedabad₹5,900Jaipur: ₹4,950Jaipur₹4,950Surat: ₹4,550Surat₹4,550
Figure 2. Average asking price per sq ft in the 13 cities covered by our guides, with Mumbai highlighted. Source: Square Yards, 2026.

At about ₹37,700 per sq ft, Mumbai is the most expensive of the 13 cities in our guides.

Map of areas, metro and roads

Schematic map of Mumbai's main residential areas, metro lines, Coastal Road and Atal Setu, with average asking pricesSchematic, not to scale. The Mumbai peninsula runs from Colaba and Nariman Point in the south through Worli, Lower Parel and Bandra to Andheri, Goregaon, Malad, Kandivali, Borivali and Dahisar in the north-west. Powai, Ghatkopar, Chembur and Mulund are in the east, with Thane to the north-east and Navi Mumbai across the harbour. Lines show Aqua Line 3, Metro Line 1, Lines 2A and 7, the Coastal Road and Atal Setu. Average asking prices range from 16,000 rupees per square foot in Thane to 67,450 in Bandra West.ThaneNavi MumbaiArabian SeaHarbourAqua Line 3 (open 2025)Line 1 (open)Lines 2A and 7 (open)Coastal Road and Sea LinkAtal Setu (open 2024)Dahisar West₹26,800Borivali West₹30,750Kandivali West₹26,800Malad West₹30,800Goregaon West₹33,400Andheri West₹41,400Juhu₹60,650Bandra West₹67,450Worli₹66,300Lower Parel₹53,450Powai₹46,300Ghatkopar West₹38,750Chembur₹34,300Mulund West₹29,150Thane₹16,000Colaba / Nariman PointSchematic, not to scale
Figure 3. Mumbai's main residential areas with average asking price per sq ft, open metro lines, the Coastal Road and Atal Setu. Schematic, not to scale.

Mumbai city is a long peninsula. South Mumbai (Colaba, Nariman Point, Malabar Hill) and the south-central areas (Worli, Lower Parel) are the most expensive. The Western Suburbs run north from Bandra to Dahisar along the Western Railway. The Central Suburbs (Ghatkopar, Powai, Mulund) and Harbour suburbs (Chembur) lie to the east. Thane and Navi Mumbai, outside the city, are part of the wider Mumbai Metropolitan Region (MMR).

Property prices by area

In short: flats in Mumbai average about ₹37,700 per sq ft. Of the areas in this guide, Kandivali West (₹26,800) and Dahisar West (₹26,800) are the cheapest, and Bandra West (₹67,450) and Worli (₹66,300) the most expensive.

Average asking price per square foot in 15 Mumbai areas, 2026Horizontal bar chart. Bandra West is highest at 67,450 rupees per square foot, then Worli at 66,300 and Juhu at 60,650. Dahisar West and Kandivali West are 26,800 within Mumbai city, and Thane is 16,000.0₹20,000₹40,000₹60,000Bandra West: ₹67,450Bandra West₹67,450Worli: ₹66,300Worli₹66,300Juhu: ₹60,650Juhu₹60,650Lower Parel: ₹53,450Lower Parel₹53,450Powai: ₹46,300Powai₹46,300Andheri West: ₹41,400Andheri West₹41,400Ghatkopar West: ₹38,750Ghatkopar West₹38,750Chembur: ₹34,300Chembur₹34,300Goregaon West: ₹33,400Goregaon West₹33,400Malad West: ₹30,800Malad West₹30,800Borivali West: ₹30,750Borivali West₹30,750Mulund West: ₹29,150Mulund West₹29,150Kandivali West: ₹26,800Kandivali West₹26,800Dahisar West: ₹26,800Dahisar West₹26,800Thane: ₹16,000Thane₹16,000
Figure 4. Average asking price per sq ft by area, June to September 2026. Source: Square Yards.

Select a column heading to sort. Enter a budget to see how much floor area it buys in each area at the average asking price.

Table 2. Prices and rental yields in 15 Mumbai areas
Zone
Bandra West₹67,450+8.8%3.7%Western Suburbs
Worli₹66,300−10.4%4.8%South-central
Juhu₹60,650−0.7%n/aWestern Suburbs
Lower Parel₹53,450−6.2%n/aSouth-central
Powai₹46,300+8.6%3.3%Central Suburbs
Andheri West₹41,400+3.6%3.8%Western Suburbs
Ghatkopar West₹38,750+32.9%n/aCentral Suburbs
Chembur₹34,300+3.4%3.6%Harbour
Goregaon West₹33,400+2.7%3.7%Western Suburbs
Malad West₹30,800+2.0%n/aWestern Suburbs
Borivali West₹30,750−1.7%3.0%Western Suburbs
Mulund West₹29,150+1.3%3.5%Central Suburbs
Kandivali West₹26,800+6.7%n/aWestern Suburbs
Dahisar West₹26,800+8.5%n/aWestern Suburbs
Thane₹16,000n/an/aThane (outside Mumbai city)

Source: Square Yards area pages, June to September 2026. Prices are averages of listed asking prices for apartments, usually on carpet area. Square Yards labels the recent change inconsistently as quarterly or yearly, and Ghatkopar West's figure looks unusually large. Yields are Square Yards' own figures. Thane is a separate city, included for comparison.

Average asking price per square foot by Mumbai zoneBar chart. South Mumbai 40,300 rupees per square foot, Harbour 39,650, Western Suburbs 35,900 and Central Suburbs 32,400.0₹15,000₹30,000₹45,000South Mumbai: ₹40,300South Mumbai₹40,300Harbour: ₹39,650Harbour₹39,650Western Suburbs: ₹35,900Western Suburbs₹35,900Central Suburbs: ₹32,400Central Suburbs₹32,400
Figure 5. Average asking price per sq ft by zone. Source: Square Yards, September 2026.
Average asking price in each Mumbai area compared with the city averageDiverging bar chart. Compared with the Mumbai average of 37,700 rupees per square foot, Bandra West is 79 percent higher and Thane is 58 percent lower.−100%−50%0%+50%+100%Bandra West+79%Worli+76%Juhu+61%Lower Parel+42%Powai+23%Andheri West+10%Ghatkopar West+3%Chembur−9%Goregaon West−11%Malad West−18%Borivali West−18%Mulund West−23%Kandivali West−29%Dahisar West−29%Thane−58%
Figure 6. Each area's average asking price compared with the city average of ₹37,700. Calculated from Square Yards data.
Mumbai areas grouped by price compared with the city averageFour panels grouping Mumbai areas by average asking price relative to the city average of 37,700 rupees per square foot. Under 75% of the city average: Kandivali West, Dahisar West. 75% to 100%: Mulund West, Borivali West, Malad West, Goregaon West, Chembur. 100% to 125%: Ghatkopar West, Andheri West, Powai. Over 125% of the city average: Lower Parel, Juhu, Worli, Bandra West.Under 75% of the cityaverage2 areasKandivali WestDahisar West75% to 100%5 areasMulund WestBorivali WestMalad WestGoregaon WestChembur100% to 125%3 areasGhatkopar WestAndheri WestPowaiOver 125% of the cityaverage4 areasLower ParelJuhuWorliBandra West
Figure 7. Areas in this guide grouped by how their average asking price compares with the Mumbai average of ₹37,700 per sq ft. Calculated from Square Yards data.

What your budget buys

Floor area that 1 crore rupees buys in each Mumbai areaBar chart. One crore rupees buys about 625 square feet in Thane and 373 in Dahisar West or Kandivali West, but only about 148 in Bandra West and 151 in Worli.0 sq ft175 sq ft350 sq ft525 sq ft700 sq ftThane: 625 sq ftThane625 sq ftKandivali West: 373 sq ftKandivali West373 sq ftDahisar West: 373 sq ftDahisar West373 sq ftMulund West: 343 sq ftMulund West343 sq ftBorivali West: 325 sq ftBorivali West325 sq ftMalad West: 325 sq ftMalad West325 sq ftGoregaon West: 299 sq ftGoregaon West299 sq ftChembur: 292 sq ftChembur292 sq ftGhatkopar West: 258 sq ftGhatkopar West258 sq ftAndheri West: 242 sq ftAndheri West242 sq ftPowai: 216 sq ftPowai216 sq ftLower Parel: 187 sq ftLower Parel187 sq ftJuhu: 165 sq ftJuhu165 sq ftWorli: 151 sq ftWorli151 sq ftBandra West: 148 sq ftBandra West148 sq ft
Figure 8. Floor area that ₹1 crore buys at each area's average asking price. Calculated from Square Yards data.
Table 3. What your budget buys in Mumbai
BudgetWhere to lookTypical size at average prices
Under ₹1 croreDahisar, Kandivali, Mira Road, Thane, Navi MumbaiAbout 370 sq ft in Mumbai city, about 625 sq ft in Thane: a 1 BHK
₹1 crore to ₹2 croreBorivali, Kandivali, Malad, Mulund, GoregaonAbout 300 to 750 sq ft: a 1 or 2 BHK
₹2 crore to ₹5 croreAndheri West, Powai, Chembur, Ghatkopar, GoregaonAbout 430 to 1,500 sq ft: a 2 or 3 BHK
Above ₹5 croreBandra, Worli, Juhu, Lower Parel, South MumbaiAbout 740 to 940 sq ft at ₹5 crore in Bandra, Worli and Lower Parel

Calculated from Square Yards average asking prices. Sizes are carpet area. Use the budget column in Table 2 for any amount.

Price of a 1,000 sq ft flat in each Mumbai area at average asking pricesBar chart. At average asking prices, a 1,000 square foot flat costs about ₹6.75 crore in Bandra West and about ₹2.68 crore in Dahisar West.0₹2 crore₹4 crore₹6 crore₹8 croreBandra West: ₹6.75 croreBandra West₹6.75 croreWorli: ₹6.63 croreWorli₹6.63 croreJuhu: ₹6.07 croreJuhu₹6.07 croreLower Parel: ₹5.34 croreLower Parel₹5.34 crorePowai: ₹4.63 crorePowai₹4.63 croreAndheri West: ₹4.14 croreAndheri West₹4.14 croreGhatkopar West: ₹3.88 croreGhatkopar West₹3.88 croreChembur: ₹3.43 croreChembur₹3.43 croreGoregaon West: ₹3.34 croreGoregaon West₹3.34 croreMalad West: ₹3.08 croreMalad West₹3.08 croreBorivali West: ₹3.08 croreBorivali West₹3.08 croreMulund West: ₹2.92 croreMulund West₹2.92 croreKandivali West: ₹2.68 croreKandivali West₹2.68 croreDahisar West: ₹2.68 croreDahisar West₹2.68 crore
Figure 9. What a typical 1,000 sq ft flat (roughly a 2 BHK) costs in each area at its average asking price, before stamp duty and other costs. Calculated from Square Yards data.

Price trends

ANAROCK average Mumbai city home price in 2019 and Q2 2026Column chart. The average price rose from 17,845 rupees per square foot in 2019 to 29,270 in Q2 2026, up 64 percent.₹17,8452019₹29,270Q2 2026+64% in about seven years
Figure 10. ANAROCK average quoted price for Mumbai city. Source: ANAROCK Research, August 2026.
Average price per square foot in Mumbai city, Thane and Navi Mumbai, 2019 and Q2 2026Dot chart. Mumbai rose from 17,845 to 29,270 rupees per square foot, up 64 percent; Thane from 8,785 to 14,300, up 63 percent; Navi Mumbai from 6,860 to 11,720, up 71 percent.2019Q2 20260₹10,000₹20,000₹30,000Mumbai city: ₹17,845 to ₹29,270Mumbai city₹29,270 · +64%Thane: ₹8,785 to ₹14,300Thane₹14,300 · +63%Navi Mumbai: ₹6,860 to ₹11,720Navi Mumbai₹11,720 · +71%
Figure 11. Average price per sq ft, 2019 and Q2 2026. Source: ANAROCK Research.
Average home price growth, 2019 to Q2 2026, in 11 Indian citiesBar chart. Noida rose 125 percent, Gurugram 117 percent, Hyderabad 93 percent, Bengaluru 90 percent, Navi Mumbai 71 percent, Mumbai city 64 percent, Thane 63 percent, Pune 51 percent, Chennai and Delhi 47 percent and Kolkata 45 percent.0%35%70%105%140%Noida: +125%Noida+125%Gurugram: +117%Gurugram+117%Hyderabad: +93%Hyderabad+93%Bengaluru: +90%Bengaluru+90%Navi Mumbai: +71%Navi Mumbai+71%Mumbai city: +64%Mumbai city+64%Thane: +63%Thane+63%Pune: +51%Pune+51%Chennai: +47%Chennai+47%Delhi: +47%Delhi+47%Kolkata: +45%Kolkata+45%
Figure 12. Change in average home prices, 2019 to Q2 2026. Source: ANAROCK Research, via Business Today, August 2026.

Mumbai's prices rose 64% between 2019 and mid-2026, slower than Bengaluru, Hyderabad or Gurugram but from a much higher base. Thane and Navi Mumbai rose at about the same rate.

Annual Mumbai home price growth reported by four measuresBar chart. Knight Frank's prime index 6.2 percent, Knight Frank's MMR weighted average 5 percent, ANAROCK 4 percent and NHB RESIDEX 3.7 percent.0%2%4%6%8%Knight Frank prime indexQ2 2026, top-end homes+6.2%Knight Frank weighted averageQ3 2026, MMR+5%ANAROCKQ2 2026, MMR quoted price+4%NHB RESIDEXOct–Dec 2025, Mumbai+3.7%
Figure 13. Annual Mumbai price growth from four measures. Sources: Knight Frank (via Business Today and The Hans India), ANAROCK, NHB.

All measures agree that growth has settled at 4% to 6% a year. Knight Frank ranked Mumbai 8th in the world for prime home price growth in Q2 2026.

ANAROCK average quoted price in nine MMR micro-markets, Q2 2025 and Q2 2026Dot chart. Worli rose from 75,365 to 77,655 rupees per square foot, up 3 percent. Lower Parel 3 percent, Andheri West 2 percent, Chembur and Mulund about 1.5 percent, Kolshet Road 3 percent, Panvel 6 percent, Dombivli 3 percent and Virar 5 percent.Q2 2025Q2 20260₹20,000₹40,000₹60,000₹80,000Worli: ₹75,365 to ₹77,655Worli+3.0%Lower Parel: ₹59,003 to ₹60,628Lower Parel+2.8%Andheri West: ₹44,300 to ₹45,007Andheri West+1.6%Chembur: ₹30,500 to ₹30,933Chembur+1.4%Mulund: ₹26,500 to ₹26,924Mulund+1.6%Kolshet Road, Thane: ₹16,250 to ₹16,700Kolshet Road, Thane+2.8%Panvel: ₹10,534 to ₹11,121Panvel+5.6%Dombivli: ₹10,656 to ₹10,947Dombivli+2.7%Virar: ₹8,272 to ₹8,716Virar+5.4%
Figure 14. Average quoted price per sq ft in ANAROCK's tracked MMR micro-markets. Source: ANAROCK MMR Residential Market Viewpoints, Q2 2025 and Q2 2026.

On ANAROCK's quoted prices, established Mumbai areas rose only 1% to 3% in the year to June 2026, while peripheral areas such as Panvel (+6%) and Virar (+5%) rose faster.

Area guide

Bandra West

₹67,450 per sq ft · gross yield about 3.7%. Upmarket suburb with sea-facing towers, Pali Hill and Linking Road. Suits: top-end buyers wanting a western suburb address.

Worli

₹66,300 per sq ft · gross yield about 4.8%. Luxury towers along the sea face, next to the Coastal Road and Sea Link. Suits: luxury buyers and senior executives.

Juhu

₹60,650 per sq ft. Beachside bungalows and older apartment buildings near the airport. Suits: buyers wanting a beach-side western address.

Lower Parel

₹53,450 per sq ft. Former mill district turned office and luxury-tower hub. Suits: professionals working in the Lower Parel and Worli offices.

Powai

₹46,300 per sq ft · gross yield about 3.3%. Planned lakeside township with Hiranandani Gardens and offices. Suits: families and tech or finance professionals.

Andheri West

₹41,400 per sq ft · gross yield about 3.8%. Busy western suburb with Metro Lines 1 and 2A and film studios. Suits: buyers wanting connectivity to both the airport and the west.

Ghatkopar West

₹38,750 per sq ft. Central suburb at the Metro Line 1 interchange with the Central Railway. Suits: families on the Central line.

Chembur

₹34,300 per sq ft · gross yield about 3.6%. Eastern suburb on the Eastern Freeway, with new Metro Line 2B stations. Suits: buyers wanting quick access to South Mumbai and Navi Mumbai.

Goregaon West

₹33,400 per sq ft · gross yield about 3.7%. Mid-segment western suburb near Film City and Aarey. Suits: families in the western suburbs.

Malad West

₹30,800 per sq ft. Large residential and office area around Mindspace and Infiniti Mall. Suits: office workers in Malad.

Borivali West

₹30,750 per sq ft · gross yield about 3.0%. Established northern suburb next to Sanjay Gandhi National Park. Suits: families wanting space and greenery.

Mulund West

₹29,150 per sq ft · gross yield about 3.5%. North-eastern suburb on the Central line, next to Thane. Suits: families on the Central line.

Kandivali West

₹26,800 per sq ft. Northern suburb with large redevelopment and new projects. Suits: value buyers in the western suburbs.

Dahisar West

₹26,800 per sq ft. Northern edge of Mumbai city, on Metro Lines 2A, 7 and 9. Suits: budget buyers wanting a Mumbai city address.

Thane

₹16,000 per sq ft. Separate city north-east of Mumbai with large new townships. Suits: families needing more space for the money.

Prices and yields: Square Yards, 2026. Descriptions are general; check individual buildings.

Rents and rental yield

In short: A 2 BHK typically rents for ₹55,000 to ₹90,000 a month. Gross rental yields average about 3.6%, and Worli is highest at about 4.8%.

Monthly rent for a 2 BHK in Mumbai and other cities, 2026Range bar chart. A 2 BHK rents for 55,000 to 90,000 rupees a month in Mumbai, the highest of the cities shown, against 35,000 to 65,000 in Gurugram and 28,000 to 50,000 in Bengaluru.₹0k₹25k₹50k₹75k₹100kMumbai: ₹55k–90kMumbai₹55k–90kGurugram: ₹35k–65kGurugram₹35k–65kBengaluru: ₹28k–50kBengaluru₹28k–50kNavi Mumbai: ₹25k–45kNavi Mumbai₹25k–45kThane: ₹25k–45kThane₹25k–45kPune: ₹22k–40kPune₹22k–40k
Figure 15. Monthly rent for a 2 BHK, 2026. Source: Housewise India Rent Index.

Mumbai has India's highest rents. A 2 BHK typically costs ₹55,000 to ₹90,000 a month, and rents rose 12% to 18% in the year to mid-2026, according to Housewise. Deposits are usually 3 to 6 months' rent.

Quoted monthly rent for a 2 BHK of about 700 sq ft in nine MMR micro-markets, Q2 2026Range bar chart. Worli 86,000 to 1,38,000 rupees a month, Lower Parel 82,000 to 1,31,000, Chembur 50,000 to 87,000, Andheri West 50,000 to 83,000, Mulund 42,000 to 65,000, Kolshet Road Thane 28,000 to 40,000, Panvel 19,000 to 29,000, Dombivli 15,000 to 23,500 and Virar 14,000 to 18,700.₹0k₹50k₹100k₹150kWorli: ₹86k–138kWorli₹86k–138kLower Parel: ₹82k–131kLower Parel₹82k–131kChembur: ₹50k–87kChembur₹50k–87kAndheri West: ₹50k–83kAndheri West₹50k–83kMulund: ₹42k–65kMulund₹42k–65kKolshet Road, Thane: ₹28k–40kKolshet Road, Thane₹28k–40kPanvel: ₹19k–29kPanvel₹19k–29kDombivli: ₹15k–23.5kDombivli₹15k–23.5kVirar: ₹14k–18.7kVirar₹14k–18.7k
Figure 16. Quoted rent for a 2 BHK of about 700 sq ft. Source: ANAROCK MMR Residential Market Viewpoints, Q2 2026.
Gross rental yield in nine Mumbai areasBar chart. Worli is highest at 4.8 percent, then Andheri West at 3.8 percent and Bandra West and Goregaon West at 3.7 percent. Borivali West is lowest at 3.0 percent.Top-city range, 3.2% to 4.6% (ANAROCK)0%1%2%3%4%5%6%Worli4.8%Andheri West3.8%Bandra West3.7%Goregaon West3.7%Chembur3.6%Mulund West3.5%Powai3.3%Borivali West3.0%
Figure 17. Gross rental yield by area. Source: Square Yards, 2026. Band: ANAROCK's Q2 2026 yields for India's top cities.
Price per square foot against gross rental yield in Mumbai areasScatter chart of 8 Mumbai areas. Worli has the highest yield at 4.8 percent at 66,300 rupees per square foot; Borivali West has the lowest at 3.0 percent at 30,750.₹20,000₹30,000₹40,000₹50,000₹60,000₹70,000₹80,0002%3%4%5%6%Average asking price per sq ftGross rental yieldCity average 3.6%WorliAndheri WestBandra WestGoregaon WestChemburMulund WestPowaiBorivali WestWorli: ₹66,300 per sq ft, 4.8%Andheri West: ₹41,400 per sq ft, 3.8%Bandra West: ₹67,450 per sq ft, 3.7%Goregaon West: ₹33,400 per sq ft, 3.7%Chembur: ₹34,300 per sq ft, 3.6%Mulund West: ₹29,150 per sq ft, 3.5%Powai: ₹46,300 per sq ft, 3.3%Borivali West: ₹30,750 per sq ft, 3.0%
Figure 18. Average asking price per sq ft against gross rental yield. Source: Square Yards, 2026. Hover over a dot for its figures.
ANAROCK gross rental yield, 2019 and 2026Dot chart. Mumbai city's yield rose from 3.5 percent to 4.3 percent, Gurugram from 3.5 to 4.3 percent, Bengaluru from 3.6 to 4.6 percent, Noida from 3.2 to 3.9 percent and Delhi from 2.2 to 3.2 percent.201920260%1%2%3%4%5%Mumbai city: 3.5% to 4.3%Mumbai city4.3% · +80 bpsGurugram: 3.5% to 4.3%Gurugram4.3% · +80 bpsBengaluru: 3.6% to 4.6%Bengaluru4.6% · +100 bpsNoida: 3.2% to 3.9%Noida3.9% · +70 bpsDelhi: 2.2% to 3.2%Delhi3.2% · +100 bps
Figure 19. Gross rental yield, 2019 and 2026. Source: ANAROCK Research, via Business Today, August 2026.

Most areas return 3% to 4% gross. Worli is the highest at 4.8% on Square Yards' figures. ANAROCK puts Mumbai at 4.3%, up from 3.5% in 2019, because rents rose faster than prices.

EMI or rent?

Monthly EMI compared with rent on Mumbai flats of three pricesGrouped bar chart. On a 1 crore rupee flat the EMI is about 66,900 rupees against rent of about 30,250. On 2 crore, 1,33,800 against 60,500. On 5 crore, 3,34,600 against 1,51,250.Monthly EMIMonthly rent0₹1 lakh₹2 lakh₹3 lakh₹1 crore₹66,915₹30,250₹2 crore₹1,33,830₹60,500₹5 crore₹3,34,576₹1,51,250
Figure 20. Monthly EMI and rent on the same flat: 80% loan, 20 years, 8%; rent at a 3.63% gross yield.
Table 4. Monthly EMI compared with rent on the same flat
Flat priceDown payment (20%)Monthly EMITypical monthly rentEMI ÷ rent
₹1 crore₹20 lakh₹66,915₹30,2502.2×
₹2 crore₹40 lakh₹1,33,830₹60,5002.2×
₹5 crore₹100 lakh₹3,34,576₹1,51,2502.2×

Owning costs about 2.2 times as much each month as renting the same flat, a smaller gap than in Gurugram or Navi Mumbai because Mumbai rents are high relative to prices.

Monthly EMI on a typical Mumbai flat at five interest ratesBar chart. For an ₹3.02 crore loan over 20 years, the EMI is about 2,42,967 rupees a month at 7.5 percent and 2,81,131 at 9.5 percent.0₹1,00,000₹2,00,000₹3,00,0007.5%: ₹2,42,9677.5%₹2,42,9678%: ₹2,52,2708%₹2,52,2708.5%: ₹2,61,7358.5%₹2,61,7359%: ₹2,71,3579%₹2,71,3579.5%: ₹2,81,1319.5%₹2,81,131
Figure 21. Monthly EMI on an 80% loan of ₹3.02 crore over 20 years, for a 1,000 sq ft flat at the Mumbai average of ₹37,700 per sq ft. The highlighted 8% is the rate used elsewhere in this guide.

Each half-point rise in the interest rate adds about ₹9,303 a month to the EMI on this loan, so compare lenders and ask how your rate is linked to the repo rate.

Sales, registrations and demand

Mumbai property registrations in September, selected yearsColumn chart. 4,116 registrations in September 2013, 10,694 in 2023, 12,070 in 2025 and 12,622 in 2026, a 14-year high for the month.4,116Sept 201310,694Sept 202312,070Sept 202512,622Sept 2026
Figure 22. Property registrations in Mumbai in September. Source: Knight Frank India, October 2026.

Mumbai recorded 12,622 property registrations in September 2026, up 5% on a year earlier and the most for any September in 14 years. Stamp duty collections fell 5% to ₹1,227 crore, because more of the sales were of cheaper homes. Registrations during the Ganesh festival window rose 22%.

Mumbai office market, H1 2026Four panels: 7.3 million square feet of office space leased in H1 2026, up 33 percent and a half-year record; average office rent 130 rupees per square foot a month; MMR housing sales of 72,804 in January to September 2026, up 1 percent; and 25,449 homes sold in Q3 2026, the most in a quarter since 2018.7.3 mn sq ftOffice space leased, H12026 (+33%)Knight Frank₹130Office rent per sq ft amonthKnight Frank72,804Homes sold in MMR,Jan–Sep 2026+1%, Knight Frank25,449Homes sold in Q3 2026Most since 2018
Figure 23. Mumbai office and housing market. Source: Knight Frank India.

Across the Mumbai region, Knight Frank counted 72,804 homes sold in January to September 2026, up 1%, with Q3 the strongest quarter since 2018. Launches rose 13%, but unsold stock fell 2% to about 1.55 lakh homes. Office leasing hit a half-year record of 7.3 million sq ft in H1 2026, which supports housing demand.

Share of MMR home sales by price, January to September 2026Bar chart. Homes below 50 lakh rupees were 36 percent of sales, 50 lakh to 1 crore 24 percent, 1 to 2 crore 22 percent, 2 to 5 crore 14 percent and above 5 crore 4 percent.0%10%20%30%40%Below ₹50 lakh: 36%Below ₹50 lakh36%₹50 lakh–1 crore: 24%₹50 lakh–1 crore24%₹1–2 crore: 22%₹1–2 crore22%₹2–5 crore: 14%₹2–5 crore14%Above ₹5 crore: 4%Above ₹5 crore4%
Figure 24. Share of MMR home sales by price, January to September 2026. Calculated from Knight Frank figures.
Change in MMR home sales by price band, January to September 2026 against a year earlierDiverging bar chart. Sales below 50 lakh rupees fell 6 percent and 50 lakh to 1 crore fell 1 percent. Sales rose 9 percent at 1 to 2 crore, 11 percent at 2 to 5 crore, 16 percent at 5 to 10 crore, 40 percent at 10 to 20 crore and 35 percent at 20 to 50 crore.-10%+0%+10%+20%+30%+40%Below ₹50 lakh−6%₹50 lakh–1 crore−1%₹1–2 crore+9%₹2–5 crore+11%₹5–10 crore+16%₹10–20 crore+40%₹20–50 crore+35%
Figure 25. Change in MMR home sales by price band, January to September 2026 against a year earlier. Source: Knight Frank India.

Buyers are moving up. Sales below ₹1 crore fell, while sales of ₹10 crore to ₹20 crore homes rose 40%. Mumbai accounted for 41 of the 53 homes priced above ₹50 crore sold across India's eight largest cities. In Mumbai city, the average home sold in H1 2026 cost ₹2.38 crore, and homes of ₹5 crore and more made up 40% of sales value.

MMR homes launched, sold and unsold, Q2 2026 (ANAROCK)Bar chart. 34,550 homes launched, 28,700 sold and 192,300 unsold at the end of June 2026.050,0001,00,0001,50,0002,00,000Launched, Q2 2026: 34,550Launched, Q2 202634,550Sold, Q2 2026: 28,700Sold, Q2 202628,700Unsold, June 2026: 1,92,300Unsold, June 20261,92,300
Figure 26. MMR homes launched, sold and unsold. Source: ANAROCK, Q2 2026.

ANAROCK's figures are less upbeat: MMR sales fell 8% in Q2 2026 while launches rose 23%, and unsold stock rose 9% to 1.92 lakh homes, about 18 months of sales. The two firms count different projects, so read them together.

Mumbai vs. Thane vs. Navi Mumbai

Table 5. Mumbai city, Thane and Navi Mumbai compared
MeasureMumbai cityThaneNavi MumbaiSource
Average price, Q2 2026₹29,270₹14,300₹11,720ANAROCK
Price change, 2019 to 2026+64%+63%+71%ANAROCK
Gross rental yield4.3%3.5%3.6%ANAROCK
2 BHK rent per month₹55,000 to ₹90,000₹25,000 to ₹45,000₹25,000 to ₹45,000Housewise
Stamp duty, man6%7%7%Maharashtra rates

Thane and Navi Mumbai rates include a 1% local body tax where it applies; confirm for the exact location.

Metro, Coastal Road and infrastructure

Mumbai metro and road infrastructure timelineTimeline. 2024: Coastal Road Phase 1 and Atal Setu open. October 2025: Aqua Line 3 fully open. April to August 2026: Line 2B and Line 9 partly open. November 2026 to January 2027: Line 9 to Mira-Bhayandar and Line 7A to the airport, as targets. Around December 2028: Lines 2B, 4, 4A, 5 and 6, as targets.2024Coastal Road Phase 1 (Marine Lines–Worli) and Atal Setu openOct 2025Aqua Line 3 fully open, Aarey to Cuffe ParadeApr–Aug 2026Line 2B (Mandale–Chembur–Diamond Garden) and Line 9(Kashigaon–Dahisar) partly openNov 2026–Jan 2027Line 9 to Mira-Bhayandar; Line 7A to airport Terminal 2 (targets)~Dec 2028Lines 2B, 4, 4A, 5 and 6 (targets)
Figure 27. Mumbai metro and road milestones. Dates after mid-2026 are official targets and may slip. Sources: Wikipedia (Mumbai Metro, Coastal Road).
  • Aqua Line 3. Mumbai's first underground metro, 33.5 km from Aarey to Cuffe Parade via the airport, BKC, Worli and Churchgate, fully open since 9 October 2025.
  • Coastal Road. The 10.6 km southern section from Marine Lines to the Worli end of the Bandra–Worli Sea Link opened in March 2024. The northern extension, including the Versova–Bandra Sea Link, is under construction.
  • Atal Setu. The sea bridge from Sewri to Navi Mumbai opened in January 2024, linking South Mumbai to Navi Mumbai and the new airport there.
  • Metro Lines 2B and 9. Partly open since 2026, with full openings targeted for 2026 to 2028. Line 7A to the airport's Terminal 2 is targeted for January 2027.
  • Lines 4, 4A, 5 and 6. Targeted for around December 2028, linking Thane, Wadala, Bhiwandi and Vikhroli with the western suburbs.

The open projects have already lifted prices in Worli, BKC and along the Aqua Line. The next wave of metro lines mainly affects Thane, Mira-Bhayandar, Chembur and the eastern suburbs.

Redevelopment

How housing society redevelopment works in MumbaiThree panels: the society of an ageing building agrees to redevelop; a developer builds a new tower and existing members get larger flats; extra flats sold to new buyers fund the project.Old buildingSociety of an ageingbuilding agrees to redevelop→DeveloperBuilds a new tower; existingmembers get larger flats→Sale flatsExtra flats sold to newbuyers fund the project
Figure 28. How housing society redevelopment works.

Much of Mumbai's new supply in established suburbs comes from redeveloping old housing societies. Existing members get larger new flats, and the developer sells the extra flats to fund the project. For buyers, a sale flat in a redevelopment can offer an established location at a new-building price. Check the development agreement with the society, MahaRERA registration, all approvals and the developer's record, because delays and disputes are common.

Stamp duty and buying costs

In short: on a ₹1 crore home, stamp duty and registration come to about ₹6.3 lakh for a man and ₹5.3 lakh for a woman buying alone, among the lowest of the 13 cities in our guides.

How Mumbai stamp duty is made upStacked bar chart. For a man, 5 percent stamp duty plus 1 percent metro cess makes 6 percent. For a woman, 4 percent plus 1 percent makes 5 percent.Stamp dutyMetro cess0%2%4%6%8%Man, or joint with a man5%1%6%Woman buyer4%1%5%
Figure 29. Stamp duty components in Mumbai.
Stamp duty and registration on a 1 crore rupee home in 13 Indian citiesGrouped bar chart of stamp duty plus registration on a 1 crore rupee home in 13 cities, for a man and for a woman. Surat: 5.9 lakh for a man and 4.9 lakh for a woman; Ahmedabad: 5.9 lakh for a man and 4.9 lakh for a woman; Mumbai: 6.3 lakh for a man and 5.3 lakh for a woman; Delhi: 7.0 lakh for a man and 5.0 lakh for a woman; Kolkata: 7.0 lakh for a man and 7.0 lakh for a woman; Chennai: 7.0 lakh for a man and 7.0 lakh for a woman; Navi Mumbai: 7.3 lakh for a man and 6.3 lakh for a woman; Pune: 7.3 lakh for a man and 6.3 lakh for a woman; Gurugram: 7.5 lakh for a man and 5.5 lakh for a woman; Hyderabad: 7.5 lakh for a man and 7.5 lakh for a woman; Bengaluru: 7.6 lakh for a man and 7.6 lakh for a woman; Noida: 8.0 lakh for a man and 7.0 lakh for a woman; Jaipur: 9.0 lakh for a man and 7.7 lakh for a woman.ManWoman0₹2.5 lakh₹5 lakh₹7.5 lakh₹10 lakhSurat₹5.9 lakh₹4.9 lakhAhmedabad₹5.9 lakh₹4.9 lakhMumbai₹6.3 lakh₹5.3 lakhDelhi₹7.0 lakh₹5.0 lakhKolkata₹7.0 lakh₹7.0 lakhChennai₹7.0 lakh₹7.0 lakhNavi Mumbai₹7.3 lakh₹6.3 lakhPune₹7.3 lakh₹6.3 lakhGurugram₹7.5 lakh₹5.5 lakhHyderabad₹7.5 lakh₹7.5 lakhBengaluru₹7.6 lakh₹7.6 lakhNoida₹8.0 lakh₹7.0 lakhJaipur₹9.0 lakh₹7.7 lakh
Figure 30. Stamp duty plus registration on a ₹1 crore home in the main city area, for a man and a woman buying alone. Calculated from state rates in our city guides; Bengaluru includes an estimated cess.
Table 6. Stamp duty and registration in Mumbai
ChargeMan or joint with a manWoman buyer
Stamp duty5%4%
Metro cess1%1%
Total6%5%
Registration1%, capped at ₹30,0001%, capped at ₹30,000

Charged on the higher of the agreement value and the ready reckoner value. Maharashtra kept ready reckoner rates unchanged for April 2026 to March 2027. Sources differ on whether a further surcharge applies in some cases; confirm with the sub-registrar or the IGR Maharashtra website.

Table 7. Other costs to budget for
CostTypical amountNotes
GST5% of priceUnder-construction homes only; 1% for homes that qualify as affordable
BrokerageAbout 1% to 2%Mainly on resale; negotiable
Society transfer chargesVariesCapped by Maharashtra co-operative society rules
Property taxAnnualPaid to the Brihanmumbai Municipal Corporation (BMC)
Cash needed upfront to buy a 1 crore rupee home in MumbaiStacked bar chart for a man or joint buyer with an 80 percent home loan. A resale home needs about 27.3 lakh rupees upfront: a 20 lakh down payment, about 6.3 lakh in stamp duty and registration and 1 lakh brokerage. A new under-construction flat needs about 31.3 lakh: the down payment, about 6.3 lakh in duty and registration and 5 lakh GST.Down payment (20%)Duty and registrationBrokerageGST0₹8 lakh₹16 lakh₹24 lakh₹32 lakhResale, ready to move₹27.3 lakhNew flat, under construction₹31.3 lakh
Figure 31. Cash needed upfront on a ₹1 crore home with an 80% loan, for a man or joint buyer: the down payment plus costs that banks do not usually finance. Excludes interiors, maintenance deposits and loan fees.

Banks lend against the property price, so stamp duty, registration and GST usually have to come from your own savings on top of the down payment. Plan for about ₹27 lakh to ₹31 lakh in cash for every ₹1 crore of property.

Buying cost calculator

–Stamp duty
–Registration fee
–GST
–Brokerage
–Total cost of purchase

Stamp duty on the price entered; if the ready reckoner value is higher, duty is charged on that. Excludes society transfer charges, maintenance, interiors and loan fees. An estimate, and not legal or tax advice.

Buyer's checklist

Eight checks before buying property in MumbaiEight numbered steps: MahaRERA registration, 30-year title search, occupancy and commencement certificates, society no-objection certificate, ready reckoner rate, dues and share certificate, site visit, full budget.1MahaRERAregistration→2Title search (30years)→3OC and CC→4Society NOC5Ready reckoner rate→6Dues and sharecertificate→7Site visit→8Full budget
Figure 32. Eight checks before you buy. Details below.
  1. Check MahaRERA registration. Search the project on the MahaRERA website and read its approvals, timelines and complaints.
  2. Search the title. Have a lawyer search the title for at least 30 years and check encumbrances.
  3. Check the CC and OC. Confirm the commencement certificate and, for a ready flat, the occupancy certificate.
  4. Get the society NOC. For resale, get the housing society's no-objection certificate.
  5. Look up the ready reckoner rate. Stamp duty is charged on the higher of the agreement value and the ready reckoner value.
  6. Check dues and the share certificate. Confirm property tax, maintenance and utility dues are paid, and the share certificate transfers.
  7. Visit the site. Visit at rush hour and in the monsoon to check traffic, waterlogging and water supply.
  8. Budget for all costs. Add stamp duty, registration, GST on under-construction homes, brokerage and interiors.
Typical steps and timing to buy a flatTimeline of six steps: 1, Shortlist and visit, about 2–6 weeks; 2, Legal and RERA checks, about 1–2 weeks; 3, Token and sale agreement, about 1 week; 4, Home loan sanction, about 2–4 weeks; 5, Pay duty and register, about 1–2 days; 6, Possession and transfer, about 2–8 weeks.1Shortlist andvisit2–6 weeks2Legal and RERAchecks1–2 weeks3Token and saleagreement1 week4Home loansanction2–4 weeks5Pay duty andregister1–2 days6Possession andtransfer2–8 weeks
Figure 33. Typical steps and timing to buy a ready flat with a home loan. Times are indicative and vary by property, lender and sub-registrar office.
Eight documents to collect before buying a flatEight panels: Title deed and chain: Sale deeds proving the seller owns it; Encumbrance certificate: No loans or claims on the property; Approved building plan: Sanctioned by the local authority; Completion or occupancy: Certificate for a ready building; RERA registration: For new or under-construction projects; Tax and utility receipts: Paid up to date, no dues; Society NOC: No-objection and no-dues letter; Land record extract: Matches the seller's name and area.Title deed andchainSale deeds proving theseller owns itEncumbrancecertificateNo loans or claims on thepropertyApprovedbuilding planSanctioned by the localauthorityCompletion oroccupancyCertificate for a readybuildingRERAregistrationFor new or under-construction projectsTax and utilityreceiptsPaid up to date, no duesSociety NOCNo-objection and no-duesletterLand recordextractMatches the seller's nameand area
Figure 34. Documents to collect and have checked by a lawyer before you pay more than a token amount. Names vary by state; see the checklist above for local terms.

Ready vs. under construction

Extra costs on a 3 crore rupee flat in Mumbai, ready versus under construction, for a male buyerStacked bar chart. A ready resale flat costs about 21.3 lakh rupees on top of the price: 18 lakh stamp duty, 3 lakh brokerage and 30,000 registration. An under-construction flat costs about 33.3 lakh: 18 lakh stamp duty, 15 lakh GST and 30,000 registration.Stamp dutyGSTBrokerage and registration₹0 lakh₹10 lakh₹20 lakh₹30 lakhReady to move (resale)₹21.3 lakhUnder construction₹33.3 lakh
Figure 35. Costs on top of the price for a ₹3 crore flat bought by a man. Resale includes 1% brokerage. GST at 5% applies to under-construction homes that do not qualify as affordable.
Table 8. Ready-to-move and under-construction homes compared
FactorReady to moveUnder construction
GSTNone5% (1% if affordable)
ChoiceResale in established buildingsNew towers and redevelopment projects
RiskOlder buildings may need repairsDelivery delays, especially in redevelopment
Rent or move inImmediatelyAfter possession, often three to five years

Outlook for 2026 and 2027

  • Demand is steady. Registrations are at record levels and Knight Frank's sales are slightly up.
  • Prices are rising moderately. 4% to 6% a year on most measures.
  • Buyers are trading up. Sales above ₹2 crore are growing while sales below ₹1 crore shrink.
  • New infrastructure keeps arriving. More metro lines open in 2026 to 2028, and the Coastal Road's northern section is being built.
  • Loans are dearer. The RBI raised the repo rate to 5.50% in October 2026, so EMIs on floating-rate loans will rise.

The data points to a stable market with modest price growth. No reliable price forecast has been published.

Risks

  • Affordability. Mumbai is India's least affordable housing market; an EMI takes a large share of income.
  • Redevelopment delays. Projects can stall over society disputes or approvals.
  • Older buildings. Check structural condition and repair liabilities.
  • Monsoon flooding. Some low-lying areas flood regularly; visit in the rains.
  • Small homes for the price. Carpet areas are small, so check usable space carefully.

Glossary

MMR
Mumbai Metropolitan Region: Mumbai city plus Thane, Navi Mumbai, Kalyan-Dombivli, Mira-Bhayandar, Vasai-Virar and Panvel.
Ready reckoner rate
The government's minimum property value per square metre, used for stamp duty.
Carpet area
The usable floor area inside a flat's walls. Maharashtra prices are usually quoted on it.
OC and CC
Occupancy certificate (the building is fit to occupy) and commencement certificate (permission to start construction).
Society NOC
A no-objection certificate from the housing society, needed for resale.
Redevelopment
Rebuilding an old housing society's building, with existing members rehoused in larger flats.
MahaRERA
The Maharashtra Real Estate Regulatory Authority, where new projects must be registered.

Frequently asked questions

What is the average property price in Mumbai in 2026?

The average asking price for flats in Mumbai was about ₹37,700 per sq ft in September 2026, according to Square Yards listings. It ranges from about ₹26,800 in Dahisar and Kandivali to over ₹66,000 in Worli and Bandra West, and far more in parts of South Mumbai. ANAROCK's average quoted price for new projects in Mumbai city was ₹29,270 per sq ft in Q2 2026.

Which is the best area to buy a flat in Mumbai?

It depends on budget and commute. Bandra, Worli, Juhu and Lower Parel are the premium choices. Andheri West and Powai suit people who want good connectivity and offices nearby. Goregaon, Malad, Borivali, Kandivali and Mulund are the main mid-budget suburbs, and Thane and Navi Mumbai offer more space for the money outside Mumbai city.

How much have Mumbai property prices increased?

ANAROCK's average for Mumbai city rose 64% between 2019 and Q2 2026, from ₹17,845 to ₹29,270 per sq ft. In the latest year, growth was 4% to 6%: ANAROCK puts the Mumbai region at 4%, Knight Frank's weighted average at 5% and its prime index at 6.2%.

What is the stamp duty in Mumbai?

Stamp duty in Mumbai is 6% for men (5% duty plus 1% metro cess) and 5% for women buying in their own name. Registration is 1% of the value, capped at ₹30,000. Duty is charged on the higher of the agreement value and the ready reckoner value. Maharashtra kept ready reckoner rates unchanged for 2026-27.

How many property registrations are there in Mumbai?

Mumbai recorded 12,622 property registrations in September 2026, up 5% on a year earlier and the highest for any September in 14 years, according to Knight Frank. Stamp duty collections that month were ₹1,227 crore, down 5%, because more of the sales were of cheaper homes.

What is the rental yield in Mumbai?

Square Yards puts the average gross rental yield at about 3.6%, from about 3.0% in Borivali West to 4.8% in Worli. ANAROCK's figure for Mumbai is 4.3%. A 2 BHK typically rents for ₹55,000 to ₹90,000 a month.

What can I buy in Mumbai for ₹1 crore?

At average asking prices, ₹1 crore buys about 370 sq ft in Dahisar or Kandivali West, about 340 sq ft in Mulund or Borivali, and about 150 sq ft in Bandra West or Worli. Most buyers with this budget look at a 1 BHK in the outer suburbs, or at Thane, Mira Road or Navi Mumbai, where it buys about 625 sq ft or more.

Is it a good time to buy property in Mumbai?

Demand is steady: MMR sales rose 1% in January to September 2026 and Q3 was the best quarter since 2018. Prices are rising 4% to 6% a year and unsold stock is falling on Knight Frank's figures. Affordability is the main constraint: Mumbai is India's most expensive market, so check that the EMI fits your income.

Which metro lines are open in Mumbai?

Line 1 (Versova–Ghatkopar), Lines 2A and 7 in the western suburbs, and Aqua Line 3 from Aarey to Cuffe Parade, fully open since October 2025, are running. Parts of Line 2B and Line 9 opened in 2026. Lines 4, 4A, 5 and 6 and the rest of 2B are targeted for around December 2028.

What is redevelopment in Mumbai and is it safe to buy?

Many old housing societies are being rebuilt by developers, who give existing members larger new flats and sell the extra flats to fund the project. Buying a sale flat in a redevelopment can offer a good location, but check the society's agreement with the developer, MahaRERA registration, approvals and the developer's track record, as delays are common.

Mumbai or Thane: which is better?

Mumbai city costs about twice as much: ANAROCK puts its average at ₹29,270 per sq ft against Thane's ₹14,300. Thane offers bigger homes, newer townships and similar long-run price growth (63% since 2019 against 64%), but longer commutes to South Mumbai and the western suburbs.

What should I check before buying a flat in Mumbai?

Check MahaRERA registration, a title search going back at least 30 years, the commencement and occupancy certificates, the society's no-objection certificate and share certificate for resale, the ready reckoner rate, and that property tax, maintenance and utility dues are paid.

How we compiled this guide

  • Area prices are average asking prices for apartments from Square Yards' area pages, checked between June and October 2026. Asking prices are what sellers list, not final sale prices, and they move as listings change.
  • City-wide trends, sales and supply come from research firms such as ANAROCK, Knight Frank, PropEquity, JLL and Crisil, as labelled under each chart. Each firm tracks different projects and periods, so we show their figures side by side rather than combining them.
  • Calculated figures, such as floor area for a budget, EMIs (80% loan, 20 years, 8%), rent at a stated yield and buying costs, are our own arithmetic from those sources.
  • Stamp duty and registration rates are taken from state rules as reported by the sources listed. Confirm the exact amount with the sub-registrar before you pay.
  • Dates. This guide was published on 12 October 2026. We plan to review it in January 2027.

Sources and resources

This page is general information, and not financial, legal or tax advice. Figures are averages from the sources listed and will differ for individual properties.