Delhi Property Guide 2026: Prices by Locality, Circle Rates, Metro Impact, Rents, Costs and Buying Checklist
"Delhi has the NCR's highest home prices and, in 2026, its fastest price growth."
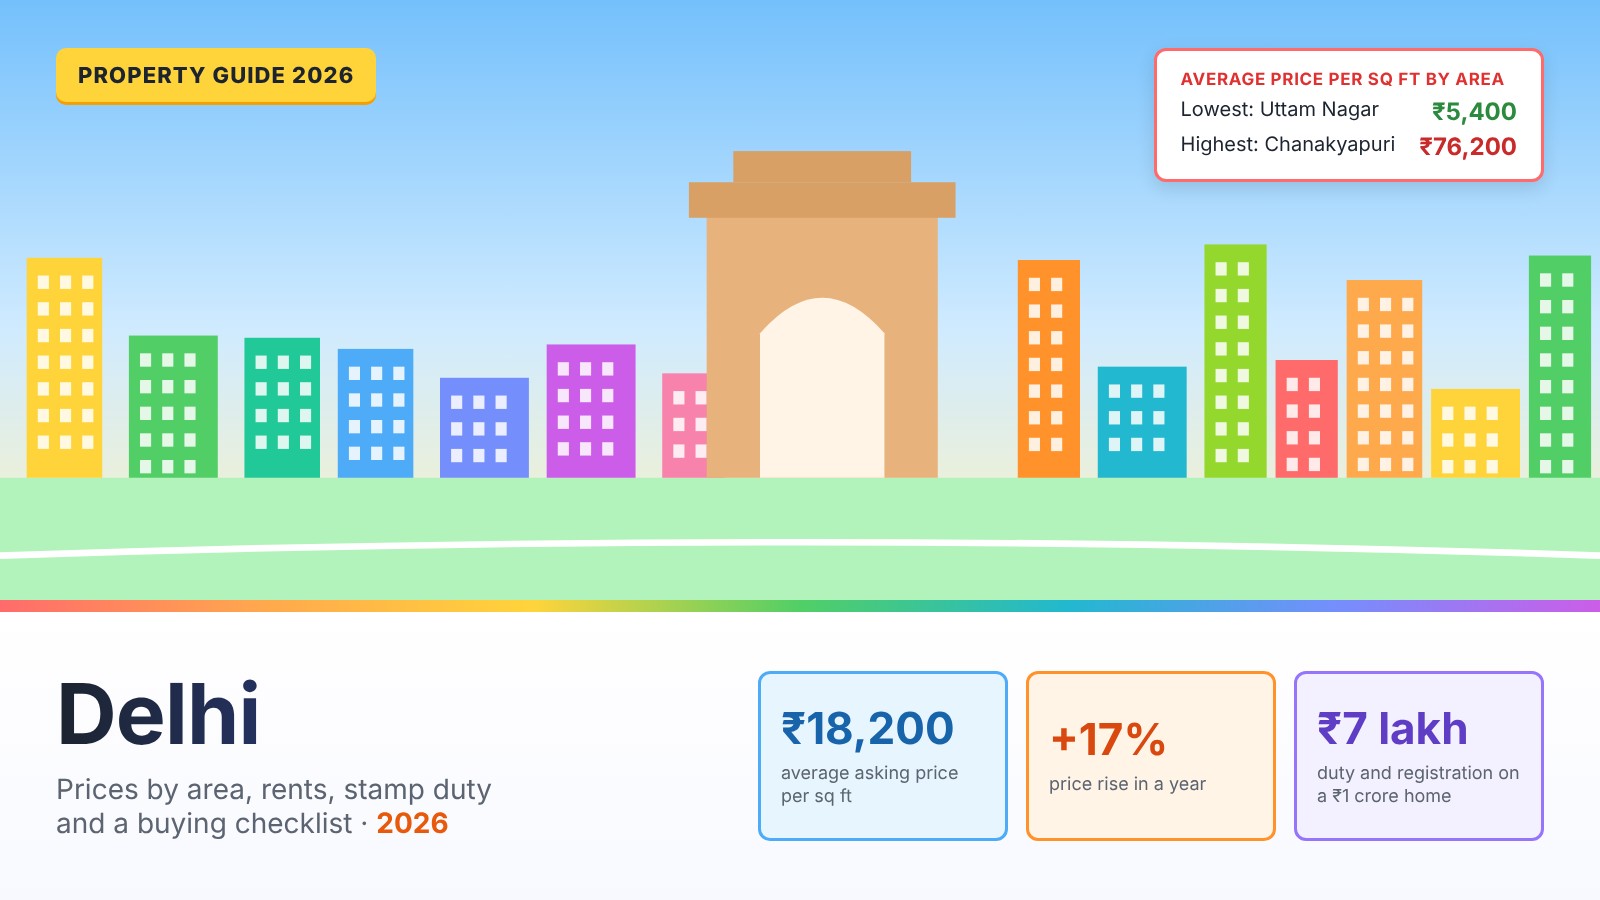
Short answer: Flats in Delhi cost about ₹18,200 per sq ft on average in 2026, according to Square Yards listings. That ranges from about ₹5,400 in Uttam Nagar to over ₹40,000 in Vasant Vihar and Defence Colony. Prices rose 47% between 2019 and mid-2026, and growth has sped up: Knight Frank puts it at 17% to 18% a year in 2026, the fastest in the NCR, led by South Delhi builder floors. Rents return about 2.8% a year. Stamp duty is 6% for men, 4% for women and 5% for joint buyers, plus 1% registration. Circle rates still date from 2014.
Key takeaways
- Flats average about ₹18,200 per sq ft, from ₹5,400 in Uttam Nagar to over ₹40,000 in Vasant Vihar and Defence Colony.
- Prices are rising 17% to 18% a year, the fastest in the NCR, and are up 47% since 2019.
- South Delhi luxury builder floors rose up to about 21% in the year to Q2 2026.
- Gross rental yields average about 2.8%, among the lowest of India's big cities.
- Stamp duty is 6% for men, 4% for women and 5% for joint buyers, plus 1% registration. Circle rates still date from 2014.
Delhi property at a glance
| Measure | Figure | Source |
|---|---|---|
| Average asking price | ₹18,200 per sq ft | Square Yards, September 2026 |
| Average apartment price | ₹26,700 per sq ft | ANAROCK, Q2 2026 |
| Weighted average price | ₹26,027 per sq ft | Knight Frank, H1 2026 |
| Price change since 2019 | +47% | ANAROCK |
| Price change, latest year | +17% to +18% | Knight Frank |
| South Delhi luxury floors, year to Q2 2026 | Up to about +21% | Golden Growth Fund |
| NCR homes sold, Jan–Sep 2026 | 35,574, −11% | Knight Frank |
| Gross rental yield | About 2.8% (Square Yards); 3.2% (ANAROCK) | Square Yards; ANAROCK |
| Stamp duty | 6% men; 4% women; 5% joint | Delhi rates |
| Circle rates | ₹23,280 to ₹7,74,000 per sq m of land | 2014 rates, still in force |
At about ₹18,200 per sq ft, Delhi is the third most expensive of the 13 cities in our guides, at about 48% of Mumbai’s average.
Map of localities and metro
Central Delhi (Lutyens' Delhi and Chanakyapuri) and the South Delhi colonies are the most expensive. West Delhi stretches from Punjabi Bagh to Janakpuri and Uttam Nagar, with the planned sub-city of Dwarka beside the airport. North-West Delhi includes Rohini and Pitampura, and East Delhi, across the Yamuna, includes Laxmi Nagar and Mayur Vihar. Noida, Gurugram and Ghaziabad lie just beyond Delhi's borders.
Property prices by locality
In short: flats in Delhi average about ₹18,200 per sq ft. Of the areas in this guide, Uttam Nagar (₹5,400) and Chattarpur (₹7,050) are the cheapest, and Chanakyapuri (₹76,200) and Vasant Vihar (₹40,850) the most expensive.
Select a column heading to sort. Enter a budget to see how much floor area it buys in each locality at the average asking price.
| Zone | |||||
|---|---|---|---|---|---|
| Chanakyapuri | ₹76,200 | n/a | n/a | Central Delhi | |
| Vasant Vihar | ₹40,850 | −0.3% | 0.8% | South Delhi | |
| Defence Colony | ₹40,200 | −5.5% | 2.9% | South Delhi | |
| Greater Kailash | ₹24,750 | −4.5% | 3.1% | South Delhi | |
| Vasant Kunj | ₹24,350 | +3.3% | 2.3% | South Delhi | |
| Janakpuri | ₹20,550 | +1.5% | 1.9% | West Delhi | |
| Punjabi Bagh | ₹20,350 | +11.3% | 1.1% | West Delhi | |
| Saket | ₹18,200 | −5.7% | 2.4% | South Delhi | |
| Mayur Vihar | ₹16,800 | +1.8% | 2.6% | East Delhi | |
| Dwarka | ₹15,600 | +2.0% | n/a | Dwarka | |
| Rohini | ₹15,300 | +17.1% | 2.6% | North Delhi | |
| Pitampura | ₹14,800 | +24.8% | 4.0% | North Delhi | |
| Laxmi Nagar | ₹11,550 | +59.7% | 1.7% | East Delhi | |
| Chattarpur | ₹7,050 | +3.8% | 5.1% | South Delhi | |
| Uttam Nagar | ₹5,400 | −9.7% | 5.3% | West Delhi |
Source: Square Yards locality and micro-market pages, June to September 2026. Prices are averages of listed asking prices for apartments and builder floors. Square Yards labels the recent change inconsistently as quarterly or yearly, and very large swings, such as Laxmi Nagar's, reflect changes in which properties are listed. Dwarka is Square Yards' micro-market average. Yields are Square Yards' own figures.
What your budget buys
| Budget | Where to look | Typical size at average prices |
|---|---|---|
| Under ₹1 crore | Uttam Nagar, Chattarpur, Laxmi Nagar, parts of Dwarka and Rohini | About 650 to 1,850 sq ft, often in older or unauthorised colonies |
| ₹1 crore to ₹2 crore | Dwarka, Rohini, Pitampura, Mayur Vihar | About 600 to 1,350 sq ft: a 2 or 3 BHK society flat |
| ₹2 crore to ₹5 crore | Saket, Janakpuri, Punjabi Bagh, Vasant Kunj, Greater Kailash | About 800 to 2,700 sq ft: a flat or a builder floor |
| Above ₹5 crore | Defence Colony, Vasant Vihar and other Category A and B colonies | Builder floors of 2,500 sq ft and more; Category A floors cost ₹18 crore or more |
Calculated from Square Yards average asking prices. Use the budget column in Table 2 for any amount.
Builder floors, DDA flats and new projects
Delhi has little open land, so most homes for sale are resales or rebuilt builder floors rather than new high-rise projects. That makes Delhi different from Noida and Gurugram: you are more likely to buy from an individual than a developer, and the legal checks matter more.
Price trends
Over the longer run, Delhi has risen more slowly than the newer markets around it, because it started from a much higher base: 47% since 2019, against 117% in Gurugram and 125% in Noida.
In 2026, Delhi led the NCR. Knight Frank puts Delhi's annual price rise at 17% in the nine months to September and 18% in the first half, driven by the scarce supply of premium homes.
South Delhi luxury market
Builder floors in Category A colonies such as Vasant Vihar, Golf Links, Jor Bagh and Panchsheel Park rose about 20% to 21% in the year to Q2 2026. Category B colonies such as Greater Kailash, Defence Colony and Safdarjung Enclave rose about 6% to 10%. A 2,500 sq ft Category A floor now costs ₹18 crore to ₹28 crore.
Locality guide
Chanakyapuri
₹76,200 per sq ft. Diplomatic enclave in Lutyens' Delhi with very few homes for sale. Suits: ultra-high-net-worth buyers.
Vasant Vihar
₹40,850 per sq ft · gross yield about 0.8% · 2 BHK rent about ₹59,950 a month. Leafy Category A colony of large builder floors near the airport and embassies. Suits: top-end buyers wanting a south-west address.
Defence Colony
₹40,200 per sq ft · gross yield about 2.9% · 2 BHK rent about ₹1,63,500 a month. Upmarket Category B colony of builder floors near the Ring Road and Lajpat Nagar. Suits: professionals wanting a central South Delhi home.
Greater Kailash
₹24,750 per sq ft · gross yield about 3.1% · 2 BHK rent about ₹71,150 a month. Established South Delhi colony with M Block market and many new builder floors. Suits: families wanting South Delhi markets and schools.
Vasant Kunj
₹24,350 per sq ft · gross yield about 2.3% · 2 BHK rent about ₹44,100 a month. Planned area of DDA flats and malls between South Delhi and the airport. Suits: airport and Gurugram commuters.
Janakpuri
₹20,550 per sq ft · gross yield about 1.9% · 2 BHK rent about ₹26,650 a month. Large planned West Delhi colony on the Blue and Magenta metro lines. Suits: families wanting metro interchange access.
Punjabi Bagh
₹20,350 per sq ft · gross yield about 1.1% · 2 BHK rent about ₹20,700 a month. Upscale West Delhi colony of bungalows and builder floors on the Ring Road. Suits: business families in West Delhi.
Saket
₹18,200 per sq ft · gross yield about 2.4% · 2 BHK rent about ₹30,600 a month. South Delhi area with Select Citywalk, hospitals and the Yellow Line. Suits: families wanting malls and hospitals nearby.
Mayur Vihar
₹16,800 per sq ft · gross yield about 2.6% · 2 BHK rent about ₹20,200 a month. East Delhi area of group housing societies on the Blue and Pink lines. Suits: commuters to Noida and central Delhi.
Dwarka
₹15,600 per sq ft. Planned sub-city of co-operative group housing societies, now on the Dwarka Expressway. Suits: families wanting space, and airport and Gurugram access.
Rohini
₹15,300 per sq ft · gross yield about 2.6% · 2 BHK rent about ₹22,850 a month. Large planned North-West Delhi sub-city on the Red and Magenta lines and near UER-II. Suits: families wanting a planned northern suburb.
Pitampura
₹14,800 per sq ft · gross yield about 4.0% · 2 BHK rent about ₹29,200 a month. Established North-West colony next to Netaji Subhash Place offices and the Red and Pink lines. Suits: families and office workers in North Delhi.
Laxmi Nagar
₹11,550 per sq ft · gross yield about 1.7% · 2 BHK rent about ₹19,550 a month. Dense East Delhi market area on the Blue Line, close to central Delhi. Suits: students and young professionals.
Chattarpur
₹7,050 per sq ft · gross yield about 5.1% · 2 BHK rent about ₹24,950 a month. Mix of farmhouses and dense low-rise housing in the south, on the Yellow Line. Suits: budget buyers wanting a South Delhi location.
Uttam Nagar
₹5,400 per sq ft · gross yield about 5.3% · 2 BHK rent about ₹17,100 a month. Dense, affordable West Delhi area on the Blue Line, where many homes are in unauthorised colonies. Suits: first-time buyers on a tight budget.
Prices, yields and rents: Square Yards, 2026. Descriptions are general; check individual properties.
Rents and rental yield
In short: A 2 BHK rents for about ₹17,000 to ₹31,000 a month in mid-market areas. Gross yields average about 2.8%, from under 1% in Vasant Vihar to over 5% in Uttam Nagar.
A 2 BHK rents for about ₹17,000 to ₹31,000 a month in most mid-market localities. South Delhi is far more expensive: about ₹44,000 in Vasant Kunj, ₹71,000 in Greater Kailash and over ₹1.6 lakh for a Defence Colony builder floor.
Expensive localities return the least: Vasant Vihar earns under 1% and Punjabi Bagh about 1%. Cheaper areas such as Uttam Nagar and Chattarpur earn over 5%, and Pitampura about 4%.
ANAROCK's yields are calculated differently from Square Yards'. On its figures, Delhi's yield rose from 2.2% to 3.2% since 2019, but is still the lowest of India's major cities.
EMI or rent?
| Home price | Down payment (20%) | Monthly EMI | Typical monthly rent | EMI ÷ rent |
|---|---|---|---|---|
| ₹1 crore | ₹20 lakh | ₹66,915 | ₹23,667 | 2.8× |
| ₹2 crore | ₹40 lakh | ₹1,33,830 | ₹47,333 | 2.8× |
| ₹5 crore | ₹100 lakh | ₹3,34,576 | ₹1,18,333 | 2.8× |
Owning costs about 2.8 times as much each month as renting the same home. Buying makes sense mainly if you plan to stay for many years or expect prices to keep rising.
Each half-point rise in the interest rate adds about ₹4,491 a month to the EMI on this loan, so compare lenders and ask how your rate is linked to the repo rate.
Sales and demand
NCR was the only major market where sales fell in 2026: Knight Frank counted 35,574 homes sold in January to September, down 11%. Most of the drop was in Gurugram; sales elsewhere in the NCR rose 3%. Delhi itself accounts for a small share of new-project sales, because most of its transactions are resales and builder floors that these reports do not fully capture.
The Delhi Development Authority (DDA) also sells flats through housing schemes. In 2026, several schemes offered discounts of up to 25% on unsold flats, including in Narela.
Delhi vs. Noida vs. Gurugram
| Measure | Delhi | Noida | Gurugram | Source |
|---|---|---|---|---|
| Weighted average price, H1 2026 | ₹26,027 | ₹15,109 | ₹18,354 | Knight Frank |
| Price growth, Jan–Sep 2026 | +17% | +7% | +4% | Knight Frank |
| Price change, 2019 to 2026 | +47% | +125% | +117% | ANAROCK |
| Gross rental yield, 2026 | 3.2% | 3.9% | 4.3% | ANAROCK |
| Stamp duty, man | 6% | 7% | 7% | State rates |
| Stamp duty, woman | 4% | 6% up to ₹1 crore | 5% | State rates |
See our Noida and Gurugram guides for local details.
Metro, expressways and the 2047 master plan
- Pink Line ring. The Majlis Park–Maujpur section opened on 8 March 2026, completing a 71.6 km ring around the city, India's first full metro ring.
- Magenta Line extension. The Deepali Chowk–Majlis Park section opened in March 2026, improving links for Rohini and Pitampura. The full extension from Janakpuri West to Ramakrishna Ashram Marg is expected by December 2027.
- Golden Line. A new Phase 4 line from Tughlakabad to Aerocity, with the Tughlakabad–Sangam Vihar section targeted for December 2026.
- Dwarka Expressway and UER-II. The 10.1 km Delhi section of the Dwarka Expressway and Urban Extension Road-II opened in August 2025, improving links between Dwarka, the airport, Gurugram and north-west Delhi.
- Master Plan for Delhi 2047. Approved by the DDA on 12 August 2026 and awaiting central approval. It promotes high-density housing near metro lines, easier land pooling and redevelopment of old two-storey DDA homes.
Circle rates
Delhi groups its colonies into eight categories, A to H, each with a minimum land value per square metre. The value of a flat or builder floor adds a construction cost to a share of the land value. Stamp duty is charged on the higher of the sale price and this circle rate value. The rates have not been revised since 2014. A review began in 2025 that could add a new top category and more detailed rates, but no new rates had been notified as of October 2026. Check the latest rate on the Delhi Revenue Department website.
Stamp duty and buying costs
In short: on a ₹1 crore home, stamp duty and registration come to about ₹7.0 lakh for a man and ₹5.0 lakh for a woman buying alone, in the middle of the 13 cities in our guides.
| Buyer | Most of Delhi | NDMC area | Registration |
|---|---|---|---|
| Man | 6% | 5.5% | 1% |
| Woman | 4% | 3.5% | 1% |
| Joint, man and woman | 5% | 4.5% | 1% |
NDMC is the New Delhi Municipal Council area, which covers Lutyens' Delhi. Rates in Delhi Cantonment differ. Confirm the rate with the sub-registrar before you register.
| Cost | Typical amount | Notes |
|---|---|---|
| GST | 5% of price | Under-construction homes only; 1% for homes that qualify as affordable |
| Brokerage | About 1% to 2% | Most Delhi sales are resales through brokers; negotiable |
| Conversion charges | Varies | To convert a DDA leasehold property to freehold |
| Property tax and mutation | Annual; one-off | Paid to the Municipal Corporation of Delhi or NDMC |
Banks lend against the property price, so stamp duty, registration and GST usually have to come from your own savings on top of the down payment. Plan for about ₹28 lakh to ₹32 lakh in cash for every ₹1 crore of property.
Buying cost calculator
Stamp duty on the price entered, at rates for most of Delhi; if the circle rate value is higher, duty is charged on that. Excludes conversion charges, mutation, interiors and loan fees. An estimate, and not legal or tax advice.
Buyer's checklist
- Check freehold or leasehold. Find out whether the land is freehold or leasehold; DDA leasehold properties may need conversion to freehold before sale.
- Check the colony's status. Confirm the colony is authorised, or that the seller has ownership rights under the PM-UDAY scheme.
- Search the title chain. Have a lawyer trace the title through registered sale deeds, not power-of-attorney documents.
- Check the sanctioned plan. For a builder floor, confirm the building plan was sanctioned by the municipal corporation and a completion certificate issued.
- Look up the circle rate. Stamp duty is charged on the higher of the sale price and the circle rate value.
- Check dues and mutation. Confirm property tax, utility and society dues are paid and the property is mutated in the seller's name.
- Visit the site. Check parking, water supply, power backup and how far the nearest metro station is.
- Budget for all costs. Add stamp duty, 1% registration, brokerage, GST on under-construction homes and interiors.
Ready vs. under construction
| Factor | Ready to move | Under construction |
|---|---|---|
| GST | None | 5% (1% if affordable) |
| Choice | Most of Delhi's market: resale flats and builder floors | Mainly builder floors under construction and a few projects |
| Risk | Older buildings and title issues | Unsanctioned extra floors and delays |
| Rent or move in | Immediately | After completion, often one to three years for builder floors |
Outlook for 2026 and 2027
- Prices are rising fast. 17% to 18% a year on Knight Frank's figures, the most in the NCR.
- Luxury leads. South Delhi builder floors rose up to about 21% in the year to Q2 2026.
- Supply stays tight. Delhi has little new land, so most supply is resale or rebuilt floors.
- Policy may unlock land. The 2047 master plan and land pooling could add new housing, once approved and implemented.
- Circle rates may rise. A revision would raise stamp duty on many properties.
The data points to continued price growth at the top end. No reliable price forecast has been published.
Risks
- Title and colony status. Unauthorised colonies and power-of-attorney sales carry legal risk.
- Unsanctioned construction. Some builder floors break building rules and may face action.
- Low rental yield. Rents cover only a small part of an EMI.
- Circle rate revision. Higher circle rates would raise the cost of buying.
- Air quality. Delhi's winter pollution is severe; factor this into your decision.
Glossary
- DDA
- The Delhi Development Authority, which plans the city, owns much of its land and sells flats through housing schemes.
- Builder floor
- One floor of a house rebuilt by a builder on a private plot, sold with a share of the land.
- Circle rate
- The minimum property value set by the Delhi government, used for stamp duty.
- Freehold and leasehold
- Freehold land is owned outright; leasehold land is leased, often from the DDA, and may need conversion before sale.
- Unauthorised colony
- A colony built without approved plans. Residents can apply for ownership rights under the PM-UDAY scheme.
- GPA sale
- A sale through a general power of attorney instead of a registered sale deed; it does not transfer ownership.
- Mutation
- Updating municipal records to show the new owner after a sale.
- Land pooling
- A policy under which landowners pool land for planned development and get back a share of developed land.
Frequently asked questions
What is the average property price in Delhi in 2026?
The average asking price for flats in Delhi was about ₹18,200 per sq ft in September 2026, according to Square Yards listings. It ranges from about ₹5,400 in Uttam Nagar to over ₹40,000 in Vasant Vihar and Defence Colony, and ₹76,200 in Chanakyapuri. ANAROCK's average for Delhi was ₹26,700 per sq ft in Q2 2026, and Knight Frank's weighted average was ₹26,027 in H1 2026.
How much have Delhi property prices increased?
ANAROCK's average for Delhi rose 47% between 2019 and Q2 2026, from ₹18,200 to ₹26,700 per sq ft. Growth has picked up recently: Knight Frank puts Delhi's annual price rise at 17% to 18% in 2026, the highest in the NCR. Luxury South Delhi builder floors rose up to about 21% in the year to Q2 2026.
Which is the best area to buy property in Delhi?
It depends on budget. Vasant Vihar, Defence Colony, Greater Kailash and other South Delhi colonies are the premium choices. Vasant Kunj, Saket, Janakpuri and Punjabi Bagh suit upper-middle budgets. Dwarka, Rohini, Pitampura and Mayur Vihar offer planned housing at lower prices, and Uttam Nagar and Chattarpur are the cheapest of the areas covered here.
What is the stamp duty in Delhi?
Stamp duty in Delhi is 6% for men, 4% for women and 5% for a man and woman buying jointly. Registration is 1% of the value. Rates are slightly lower in New Delhi Municipal Council areas. Duty is charged on the higher of the sale price and the circle rate value.
What are the circle rates in Delhi?
Delhi's residential land circle rates range from ₹7,74,000 per square metre in Category A colonies to ₹23,280 in Category H. These rates date from 2014. A review of circle rates was under way in 2025 and 2026, so check the Delhi Revenue Department website for the current rate.
What is the rental yield in Delhi?
Square Yards puts Delhi's average gross rental yield at about 2.8%, from under 1% in Vasant Vihar to over 5% in Uttam Nagar and Chattarpur. ANAROCK's figure is 3.2% for 2026, up from 2.2% in 2019, but still the lowest of India's major cities.
What can I buy in Delhi for ₹1 crore?
At average asking prices, ₹1 crore buys about 1,850 sq ft in Uttam Nagar, about 650 sq ft in Rohini or Dwarka, about 550 sq ft in Saket, and about 250 sq ft in Vasant Vihar or Defence Colony. Most buyers with this budget look at a 2 BHK in Dwarka, Rohini, Pitampura or Mayur Vihar, or in Noida, Ghaziabad or Gurugram.
What is a builder floor in Delhi?
A builder floor is one floor of a house that a builder has rebuilt on a private plot, usually with three or four floors and a share of the land. They are the most common new homes in South and West Delhi. Check the sanctioned building plan, the completion certificate and the title of the plot before buying.
Is it safe to buy in an unauthorised colony in Delhi?
Many Delhi homes are in unauthorised colonies. Under the PM-UDAY scheme, residents can apply for ownership rights, but these colonies may lack approved building plans, and banks are often reluctant to lend. Get legal advice and check that the seller has PM-UDAY rights or a registered sale deed.
Is it a good time to buy property in Delhi?
Prices are rising quickly, about 17% a year on Knight Frank's figures, driven by South Delhi luxury builder floors. New infrastructure such as the Dwarka Expressway and the Pink Line ring has improved access. But NCR sales fell 11% in January to September 2026, and rental yields are low, so buying is mainly a long-term decision.
What is the Master Plan for Delhi 2047?
The Delhi Development Authority approved the Master Plan for Delhi 2047 on 12 August 2026. It promotes more housing along metro corridors, easier land pooling and redevelopment of old two-storey DDA homes. It still needs approval from the Ministry of Housing and Urban Affairs before it is notified.
What should I check before buying a property in Delhi?
Check whether the property is freehold or leasehold, whether the colony is authorised, the full title chain, the sanctioned building plan and completion certificate, the circle rate, and that property tax and mutation records are up to date. Avoid power-of-attorney (GPA) sales; insist on a registered sale deed.
Related guides
How we compiled this guide
- Area prices are average asking prices for apartments from Square Yards' area pages, checked between June and October 2026. Asking prices are what sellers list, not final sale prices, and they move as listings change.
- City-wide trends, sales and supply come from research firms such as ANAROCK, Knight Frank, PropEquity, JLL and Crisil, as labelled under each chart. Each firm tracks different projects and periods, so we show their figures side by side rather than combining them.
- Calculated figures, such as floor area for a budget, EMIs (80% loan, 20 years, 8%), rent at a stated yield and buying costs, are our own arithmetic from those sources.
- Stamp duty and registration rates are taken from state rules as reported by the sources listed. Confirm the exact amount with the sub-registrar before you pay.
- Dates. This guide was published on 12 October 2026. We plan to review it in January 2027.
Sources and resources
- Square Yards: Delhi property rates and locality pages for Vasant Vihar, Defence Colony, Greater Kailash, Vasant Kunj, Saket, Janakpuri, Rohini, Pitampura, Mayur Vihar, Uttam Nagar
- ANAROCK: prices and yields since 2019 (Business Today), NCR five-year price rise (Outlook Money), NCR Residential Market Viewpoints, Q2 2026
- Knight Frank: India Real Estate H1 2026, nine-month 2026 sales and prices (Construction World)
- South Delhi luxury floor prices, Q2 2026 (The Realty Today)
- Stamp duty and circle rates: Delhi stamp duty and registration (ClearTax), circle rates in Delhi 2026 (Realty Hunting), circle rate revision (Outlook Money)
- Infrastructure and planning: Pink and Magenta line openings (Metro Rail News), Magenta Line (Wikipedia), Dwarka Expressway and UER-II (PM India), Master Plan for Delhi 2047 (Business Standard)
- Official portals: Delhi Development Authority, Delhi Revenue Department (registration and circle rates), Delhi RERA, Municipal Corporation of Delhi, Delhi Metro Rail Corporation
This page is general information, and not financial, legal or tax advice. Figures are averages from the sources listed and will differ for individual properties.