Bangalore Property Guide 2026: Prices by Area, Metro Impact, Rents, Khata Rules, Costs and Buying Checklist
"Bengaluru's housing market is driven by its tech workforce and an expanding metro network."
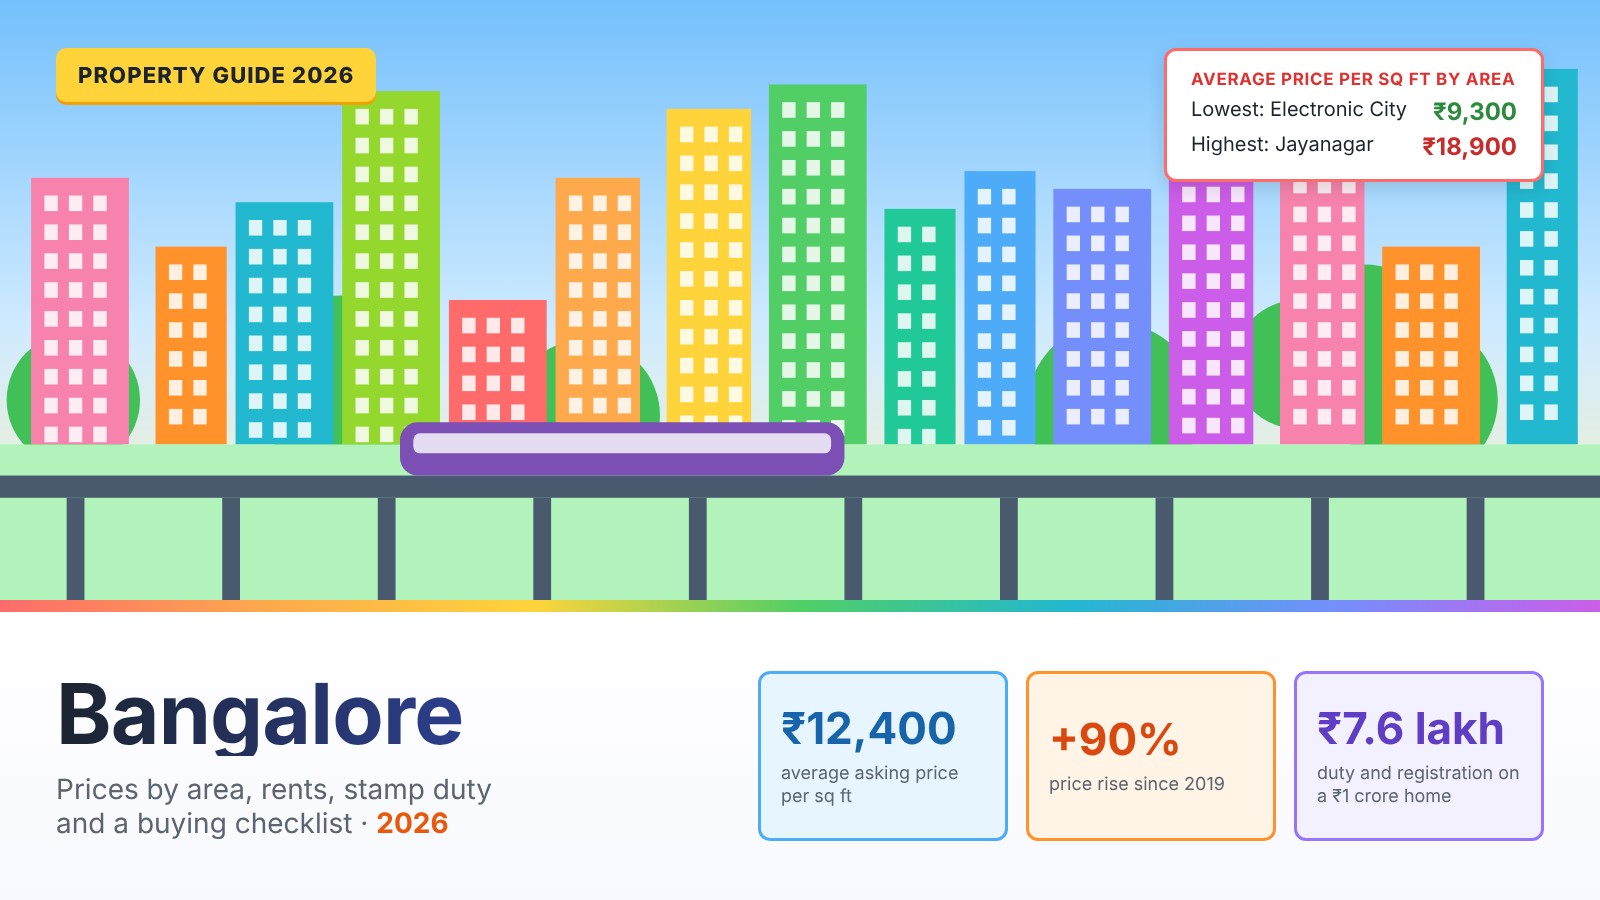
Short answer: Flats in Bangalore cost about ₹12,400 per sq ft on average in 2026, from about ₹9,300 in Electronic City to ₹18,750 in Indiranagar and Koramangala. Prices have nearly doubled since 2019 but are now rising 8% to 9% a year, and supply is outrunning sales. Gross rental yields of about 3% to 4.8% are among India's highest. Stamp duty and registration together cost about 7% to 7.6%, and every purchase now needs a valid e-Khata.
Key takeaways
- Flats average about ₹12,400 per sq ft, from ₹9,300 in Electronic City to ₹18,750 in Indiranagar and Koramangala.
- Prices have nearly doubled since 2019 and are now rising 8% to 9% a year, while supply is outrunning sales.
- Gross rental yields of about 3% to 4.8% are among India's highest.
- Stamp duty and registration together cost about 7% to 7.6%; registration has been 2% since August 2025.
- Every purchase now needs a valid e-Khata.
Bangalore property at a glance
| Measure | Figure | Source |
|---|---|---|
| Average asking price | ₹12,400 per sq ft | Square Yards, mid-2026 |
| Average price, new sales | ₹9,354 per sq ft, +9% in a year | Knight Frank, H1 2026 |
| Price change since 2019 | +90% | ANAROCK |
| Homes sold, H1 2026 | 27,968, +5% | Knight Frank |
| Unsold homes | 79,200, about 15 months of sales | ANAROCK, Q2 2026 |
| 2 BHK rent | ₹28,000 to ₹50,000 a month | Housewise India Rent Index 2026 |
| Gross rental yield | About 3.4% (Square Yards); 4.6% (ANAROCK) | Square Yards; ANAROCK Q2 2026 |
| Stamp duty and registration | About 7% to 7.6% above ₹45 lakh | Karnataka rates |
| Security deposit | 6 to 10 months' rent | Housewise |
At about ₹12,400 per sq ft, Bangalore is the seventh most expensive of the 13 cities in our guides, at about 33% of Mumbai’s average.
Map of areas and metro lines
Bengaluru's housing is spread around the Outer Ring Road. The central areas (Indiranagar, Koramangala, Jayanagar) are the most expensive. The biggest new supply is in the east (Whitefield, Sarjapur Road) near the tech parks, in the north (Hebbal, Thanisandra, Hennur, Yelahanka, Devanahalli) along the airport road, and in the south (Electronic City, Kanakapura Road, Bannerghatta Road).
Property prices by area
In short: flats in Bangalore average about ₹12,400 per sq ft. Of the areas in this guide, Electronic City (₹9,300) and Devanahalli (₹9,600) are the cheapest, and Jayanagar (₹18,900) and Koramangala (₹18,750) the most expensive.
Select a column heading to sort. Enter a budget to see how much floor area it buys in each area at the average asking price.
| Zone | |||||
|---|---|---|---|---|---|
| Jayanagar | ₹18,900 | −13.2% | n/a | South | |
| Indiranagar | ₹18,750 | +7.6% | 3.8% | East | |
| Koramangala | ₹18,750 | −3.8% | 3.9% | South-east | |
| Hebbal | ₹17,100 | −0.4% | 3.5% | North | |
| Whitefield | ₹14,500 | −0.8% | 3.1% | East | |
| Hennur Road | ₹12,600 | +0.4% | 3.2% | North-east | |
| Bannerghatta Road | ₹12,450 | −3.2% | 3.8% | South | |
| Sarjapur Road | ₹12,250 | +0.6% | 3.9% | South-east | |
| Kanakapura Road | ₹12,000 | +3.1% | 3.1% | South-west | |
| JP Nagar | ₹11,350 | −1.2% | n/a | South | |
| Thanisandra | ₹11,200 | +4.8% | n/a | North-east | |
| Yelahanka | ₹10,100 | +0.7% | 3.9% | North | |
| Devanahalli | ₹9,600 | +3.9% | 3.2% | North | |
| Electronic City | ₹9,300 | +3.5% | 4.8% | South |
Source: Square Yards locality pages, June to September 2026. Prices are averages of listed asking prices for apartments. Square Yards labels the recent change inconsistently as quarterly or yearly. Yields are Square Yards' own figures. Bengaluru prices are usually quoted on super built-up area.
Best areas by budget
| Budget | Where to look | Typical size at average prices |
|---|---|---|
| Under ₹1 crore | Electronic City, Devanahalli, Yelahanka, Thanisandra, Kanakapura Road | About 830 to 1,075 sq ft: a 2 BHK |
| ₹1 crore to ₹2 crore | Sarjapur Road, Hennur Road, Bannerghatta Road, Whitefield, JP Nagar | About 800 to 1,650 sq ft: a 2 or 3 BHK |
| ₹2 crore to ₹3 crore | Hebbal, Whitefield, Koramangala, Indiranagar | About 1,070 to 2,070 sq ft |
| Above ₹3 crore | Indiranagar, Koramangala, Jayanagar, central areas | About 1,590 sq ft at ₹3 crore in the costliest areas |
Prices vary within each area
An area average hides a wide range. Around Whitefield, sub-localities run from about ₹9,950 per sq ft in Kundalahalli to ₹19,000 on the Outer Ring Road. Along Sarjapur Road, prices fall from ₹18,650 in Kaikondrahalli, near the ORR, to ₹9,100 in Mullur farther out. Distance from the Outer Ring Road and the metro explains much of the gap.
| Belt | Sub-locality | Price per sq ft |
|---|---|---|
| Whitefield belt | Outer Ring Road | ₹19,000 |
| Brookefield | ₹16,850 | |
| Hoodi | ₹16,000 | |
| Balagere | ₹13,700 | |
| Varthur | ₹13,650 | |
| Kadugodi | ₹10,250 | |
| Kundalahalli | ₹9,950 | |
| Sarjapur Road belt | Kaikondrahalli | ₹18,650 |
| Chikkakannalli | ₹17,700 | |
| Bhoganhalli | ₹17,000 | |
| Panathur | ₹14,850 | |
| Carmelaram | ₹11,600 | |
| Kasavanahalli | ₹11,250 | |
| Kodathi | ₹10,400 | |
| Mullur | ₹9,100 | |
| Electronic City belt | Rayasandra | ₹11,150 |
| Hosa Road | ₹11,000 | |
| Electronic City Phase I | ₹9,650 | |
| Bommasandra | ₹8,350 | |
| Kammasandra | ₹8,150 | |
| Electronic City Phase II | ₹6,350 | |
| Hebbal and north-east | Hebbal Kempapura | ₹23,150 |
| Richards Town | ₹18,300 | |
| Off Hennur Road | ₹13,750 | |
| Rachenahalli | ₹13,450 | |
| Nagavara | ₹11,600 | |
| Airport region | Budigere | ₹11,700 |
| International Airport Road | ₹11,250 | |
| Hosahalli | ₹11,200 | |
| Bagaluru | ₹10,350 | |
| Hunasamaranahalli | ₹9,200 | |
| South and central | Kodihalli | ₹25,950 |
| Rajaji Nagar | ₹24,750 | |
| Richmond Town | ₹21,500 | |
| Old Airport Road | ₹15,900 | |
| BTM Layout | ₹13,850 | |
| Yeshwanthpur | ₹12,900 | |
| Bilekahalli | ₹10,500 |
Source: Square Yards locality pages, 2026. Sub-locality averages rest on fewer listings than area averages and can move sharply between updates.
Price trends
Bengaluru's prices rose about 90% between 2019 and mid-2026 on ANAROCK's figures, more than Mumbai (64%) or Pune (51%) and close to Hyderabad (93%).
The latest-year figures vary widely. PropTiger's 26% is a sales-weighted average that rises when buyers shift to bigger, costlier homes. ANAROCK and Knight Frank, which track prices more directly, show 8% to 9%. NHB's index of lenders' valuations shows 12.7%.
Whitefield's average more than doubled from 2019 and Sarjapur Road's nearly did. In the latest year, every corridor ANAROCK tracks rose 7% to 9%, with quarterly growth now 1% to 3%.
Area guide
Jayanagar
₹18,900 per sq ft. Old, leafy residential area with markets and metro access. Suits: families wanting an established south Bengaluru address.
Indiranagar
₹18,750 per sq ft · gross yield about 3.8%. Central, with the 100 Feet Road dining strip and Purple Line metro. Suits: professionals wanting a central lifestyle area.
Koramangala
₹18,750 per sq ft · gross yield about 3.9%. Start-up hub with offices, restaurants and older apartment blocks. Suits: tech professionals working in the south-east.
Hebbal
₹17,100 per sq ft · gross yield about 3.5%. Gateway to the airport road, with lakes and premium towers. Suits: buyers wanting north Bengaluru with quick airport access.
Whitefield
₹14,500 per sq ft · gross yield about 3.1%. Large IT hub with ITPL and many tech parks, on the Purple Line. Suits: tech workers in the eastern IT corridor.
Hennur Road
₹12,600 per sq ft · gross yield about 3.2%. Fast-growing residential corridor between ORR and the airport road. Suits: mid-budget buyers in the north-east.
Bannerghatta Road
₹12,450 per sq ft · gross yield about 3.8%. Established southern corridor; Pink Line under construction. Suits: families wanting south Bengaluru with schools and hospitals.
Sarjapur Road
₹12,250 per sq ft · gross yield about 3.9%. Big new-supply corridor near ORR tech parks and Wipro's campus. Suits: tech workers on ORR and Sarjapur.
Kanakapura Road
₹12,000 per sq ft · gross yield about 3.1%. Green southern corridor at the end of the Green Line. Suits: budget-conscious families in the south.
JP Nagar
₹11,350 per sq ft. Planned residential area with metro and Pink Line interchange. Suits: families wanting an established southern area.
Thanisandra
₹11,200 per sq ft. Residential area near Manyata Tech Park. Suits: people working at Manyata Tech Park.
Yelahanka
₹10,100 per sq ft · gross yield about 3.9%. Older satellite town on the way to the airport. Suits: value buyers in the north.
Devanahalli
₹9,600 per sq ft · gross yield about 3.2%. Airport area with plotted and new apartment projects. Suits: long-term buyers betting on the airport region.
Electronic City
₹9,300 per sq ft · gross yield about 4.8%. IT hub on Hosur Road, now on the Yellow Line metro. Suits: budget buyers and E-City employees.
Prices and yields: Square Yards, mid-2026. Descriptions are general; check individual projects.
Which area suits which buyer
| If you want | Look at | Why |
|---|---|---|
| A short commute to ORR tech parks | Sarjapur Road, Bellandur, Marathahalli, Kadubeesanahalli | ORR took 52% of office leasing in H1 2026 |
| Whitefield and ITPL jobs | Whitefield, Brookefield, Hoodi, Kadugodi | On the Purple Line, next to the tech parks |
| Manyata Tech Park jobs | Hebbal, Thanisandra, Hennur Road, Nagavara | North-east, near Manyata |
| Electronic City jobs | Electronic City, Hosa Road, Bommasandra | On the Yellow Line since 2025 |
| Quick airport access | Hebbal, Yelahanka, Devanahalli, Bagaluru | On the airport road; Blue Line planned |
| The lowest price | Electronic City, Devanahalli, Yelahanka | ₹9,300 to ₹10,100 per sq ft |
| The best rent for the price | Electronic City, Sarjapur Road, Yelahanka, Koramangala | Gross yields of 3.9% to 4.8% |
| An established central address | Indiranagar, Koramangala, Jayanagar | Mature areas with metro access |
A reading of the figures on this page, and not a recommendation.
Rents and rental yield
In short: A 2 BHK rents for ₹28,000 to ₹50,000 a month. Most areas return 3% to 4% gross, and Electronic City nearly 4.8%.
A 2 BHK in Bengaluru rents for ₹28,000 to ₹50,000 a month, and rents rose 10% to 14% in the year to mid-2026, according to Housewise. Bengaluru also has India's highest security deposits, typically 6 to 10 months' rent.
Bengaluru is one of the better Indian cities for rental income.
Most areas return 3% to 4% gross, and Electronic City nearly 4.8%. ANAROCK puts the city at 4.6%, the highest of the seven big cities it tracks, and Magicbricks at 3.9%.
EMI or rent?
| Flat price | Down payment (20%) | Monthly EMI | Typical monthly rent | EMI ÷ rent |
|---|---|---|---|---|
| ₹1 crore | ₹20 lakh | ₹66,915 | ₹28,333 | 2.4× |
| ₹1.5 crore | ₹30 lakh | ₹1,00,373 | ₹42,500 | 2.4× |
| ₹3 crore | ₹60 lakh | ₹2,00,746 | ₹85,000 | 2.4× |
Owning costs about 2.4 times as much each month as renting the same flat. That gap is smaller than in Gurugram or Navi Mumbai, because Bengaluru's yields are higher.
Each half-point rise in the interest rate adds about ₹3,060 a month to the EMI on this loan, so compare lenders and ask how your rate is linked to the repo rate.
Sales, supply and demand
Developers are building faster than buyers are buying. In Q2 2026, ANAROCK counted 21,700 homes launched, up 42% on a year earlier, against 15,300 sold, up 1%. Unsold stock rose 34% to 79,200 homes, about 15 months of sales. Knight Frank's figures for H1 2026 are steadier: 27,968 homes sold, up 5%, and 34,749 launched, up 4%.
Buyers are trading up. Homes priced ₹2 crore to ₹5 crore rose from 22% to 29% of sales in a year, and sales in that band rose 39%. Homes under ₹1 crore fell from 30% to 22%.
Jobs and the office market
Housing demand follows office jobs. Bengaluru has India's largest office market, and global capability centres (in-house tech and operations hubs of multinational companies) took 60% of space leased in H1 2026. The Outer Ring Road accounted for 52% of leasing and the eastern business district for 29%, which is why Whitefield, Sarjapur Road and the ORR belt attract so much housing.
Bangalore vs. Hyderabad vs. Pune
| Measure | Bengaluru | Hyderabad | Pune | Source |
|---|---|---|---|---|
| Average price, Q2 2026 | ₹9,450 | ₹8,090 | ₹8,300 | ANAROCK |
| Price change, 2019 to 2026 | +90% | +93% | +51% | ANAROCK |
| Price change, latest year | +8% | +6% | +5% | ANAROCK |
| Gross rental yield | 4.6% | 3.6% | 3.95% | ANAROCK |
| 2 BHK rent per month | ₹28,000 to ₹50,000 | ₹22,000 to ₹40,000 | ₹22,000 to ₹40,000 | Housewise |
| Unsold stock, months of sales | 15 | 27 | 16 | ANAROCK |
Bengaluru is the most expensive of the three and has the highest rents and yields. Hyderabad matched its long-run price growth but has far more unsold stock.
Metro and infrastructure
- Yellow Line. A 19 km elevated line with 16 stations from RV Road through Silk Board to Electronic City and Bommasandra, open since 11 August 2025.
- Pink Line. A 21 km line from Kalena Agrahara on Bannerghatta Road to Nagawara. The 7.5 km elevated section to Tavarekere had its statutory safety inspection on 6 to 8 October 2026. The safety commissioner raised observations that the metro operator, BMRCL, is addressing, and the state has asked the Prime Minister for an inauguration date, possibly around Dasara; the underground section through MG Road is targeted for about 2027.
- Blue Line. A 58 km line from Central Silk Board along the Outer Ring Road to KR Puram, then via Hebbal to the airport. The first section is targeted for around 2027 and the airport section for around 2028.
- Purple and Green Lines. The existing east–west and north–south lines, serving Whitefield, Indiranagar, MG Road, Jayanagar and Kanakapura Road.
The Blue Line is the project most likely to move prices, because it links the ORR tech belt, Hebbal and the airport region. Check the current status before paying a premium for proximity to a station.
e-Khata, A-Khata and B-Khata
A khata is the municipal record of a property and its owner. Bengaluru has moved to digital e-Khatas, managed by the Greater Bengaluru Authority (GBA), which replaced BBMP.
- e-Khata is mandatory. A valid e-Khata is required to register a sale or transfer within Bengaluru's urban limits, and to get building plans approved.
- A-Khata properties fully comply with planning rules. Banks lend against them readily.
- B-Khata properties are in unapproved layouts or have deviations. They can be bought and sold, but many lenders will not finance them.
- Conversion. Some B-Khata properties registered before 30 September 2024 can be converted to A-Khata. A drive began on 1 November 2025, and the penalty is reported at about 5% of the guidance value.
Download the seller's e-Khata from the e-Aasthi portal, check that the name matches the title deed, and get the A-Khata or B-Khata status in writing. Ask your lender to confirm it will accept the khata before you pay a token amount.
Stamp duty and buying costs
In short: on a ₹1 crore home, stamp duty and registration come to about ₹7.6 lakh for a man and the same for a woman, among the highest of the 13 cities in our guides.
| Property value | Stamp duty | Registration |
|---|---|---|
| Above ₹45 lakh | 5% plus cess and surcharge | 2% |
| ₹20 lakh to ₹45 lakh | 3% plus cess and surcharge | 2% |
| Below ₹20 lakh | 2% plus cess and surcharge | 2% |
Charged on the higher of the sale price and the guidance value. Registration rose from 1% to 2% in late August 2025. Men and women pay the same rates. Sources: PropNewz, BankBazaar. Exact cess and surcharge rates were not published in these sources; confirm on the Kaveri Online Services portal.
Guidance value vs. market price
| Area | Average asking price | Registration rate | Asking ÷ registration |
|---|---|---|---|
| Electronic City | ₹9,300 | ₹6,700 | 1.39× |
| Devanahalli | ₹9,600 | ₹6,250 | 1.54× |
Stamp duty and registration are charged on whichever is higher: the sale price or the guidance value. In most of Bengaluru, market prices are well above guidance values, so buyers pay on the agreement price. Where a deal is close to or below the guidance value, duty is charged on the guidance value. Look up the value for the exact property on the Kaveri portal.
Source: Square Yards' government registration rates, 2026. These are indicative; the official guidance value is set by the Karnataka government for each survey number or property.
| Cost | Typical amount | Notes |
|---|---|---|
| GST | 5% of price | Under-construction homes only; 1% for homes that qualify as affordable |
| Brokerage | About 1% | Mainly on resale; negotiable |
| Khata transfer | Varies | Paid to the city corporation after registration |
| Maintenance deposit | Varies by project | Often one to two years in advance in new projects |
| B-Khata conversion | About 5% of guidance value | Only if converting a B-Khata property |
Banks lend against the property price, so stamp duty, registration and GST usually have to come from your own savings on top of the down payment. Plan for about ₹29 lakh to ₹33 lakh in cash for every ₹1 crore of property.
Buying cost calculator
Slab rates applied to the price entered; if the guidance value is higher, duty is charged on that. Cess and surcharge are estimated at 12% of the stamp duty. Excludes khata transfer, maintenance, interiors and loan fees. An estimate, and not legal or tax advice.
Buyer's checklist
- Check RERA registration. Search the project on the Karnataka RERA website and read its approvals, timelines and complaints.
- Check the e-Khata. Download it from the e-Aasthi portal and confirm it is A-Khata.
- Verify the title and encumbrance certificate. Have a lawyer check the title chain and any loans against the property.
- Check the plan sanction. Confirm the building plan was approved and the building matches it.
- Ask for the occupancy certificate. For a ready flat, do not pay in full without it.
- Look up the guidance value. It sets the minimum value for stamp duty; check it on the Kaveri portal.
- Visit at rush hour and in the monsoon. Traffic, water supply and waterlogging vary sharply between areas.
- Budget for everything. Use the calculator above, then add interiors and moving costs.
Outlook for 2026 and 2027
- Prices are still rising, more slowly. 8% to 9% a year on ANAROCK's and Knight Frank's figures.
- Supply is building up. Launches and unsold stock are growing much faster than sales.
- Jobs remain strong. Global capability centres keep leasing office space, which supports housing demand in the east and north.
- The metro is expanding. The Pink and Blue Lines should open in stages over 2026 to 2028.
- Loans are dearer. The RBI raised the repo rate to 5.50% in October 2026.
The data points to a steady market with more choice for buyers. No reliable price forecast has been published.
Risks
- Khata problems. B-Khata or missing e-Khata can block loans and resale.
- Oversupply. Unsold stock rose 34% in a year, mostly in the east and north.
- Traffic and water. Commute times and water supply differ greatly between areas; peripheral projects may rely on tankers.
- Tech-sector dependence. A slowdown in IT hiring would hit demand in the tech corridors first.
- Delivery delays. Check the developer's delivery record on Karnataka RERA.
Glossary
- e-Khata
- The digital municipal record of a property and its owner, issued through the e-Aasthi portal.
- A-Khata and B-Khata
- Registers for fully approved properties and for properties in unapproved layouts or with deviations.
- Guidance value
- The government's minimum property value for an area, used for stamp duty. Also called the circle rate elsewhere.
- GBA
- The Greater Bengaluru Authority, which replaced BBMP as the city's civic body.
- Encumbrance certificate (EC)
- A record showing whether a property has loans or other claims registered against it.
- ORR
- The Outer Ring Road, the arterial road lined with tech parks from Hebbal to Silk Board.
- Super built-up area
- Carpet area plus walls, balconies and a share of common areas. Most Bengaluru prices are quoted on it.
- GCC
- Global capability centre: an in-house tech or operations hub of a multinational company.
Frequently asked questions
What is the average property price in Bangalore in 2026?
The average asking price for flats in Bengaluru was about ₹12,400 per sq ft in mid-2026, according to Square Yards listings. Knight Frank's average for new sales in H1 2026 was ₹9,354 per sq ft and ANAROCK's was ₹9,450 in Q2 2026. Localities range from about ₹9,300 in Electronic City to ₹18,750 in Indiranagar and Koramangala.
Which is the best area to buy a flat in Bangalore?
It depends on where you work and your budget. Whitefield and Sarjapur Road suit people working in the eastern tech parks and on the Outer Ring Road. Hebbal, Thanisandra and Hennur Road suit north Bengaluru and Manyata Tech Park. Electronic City and Kanakapura Road are the main value options in the south, and Indiranagar, Koramangala and Jayanagar are the established central addresses.
How much have Bangalore property prices increased?
ANAROCK's average for Bengaluru rose 90% between 2019 and Q2 2026, from ₹4,975 to ₹9,450 per sq ft. Over the latest year, sources put growth between 8% (ANAROCK) and 26% (PropTiger), with Knight Frank at 9% and NHB at 12.7%. The differences come from what each source measures.
What is the stamp duty and registration charge in Bangalore?
For homes above ₹45 lakh, stamp duty is 5% of the higher of the sale price and the guidance value, plus a small cess and surcharge. Registration has been 2% since late August 2025, up from 1%. Together they come to roughly 7% to 7.6%. Homes of ₹20 lakh to ₹45 lakh pay 3% stamp duty and homes below ₹20 lakh pay 2%. Men and women pay the same rates.
What is e-Khata and is it mandatory in Bangalore?
An e-Khata is the digital property record issued by the Greater Bengaluru Authority, which replaced BBMP. A valid e-Khata is required to register a sale or transfer within Bengaluru's urban limits, and to get building plans approved. Download the seller's e-Khata from the e-Aasthi portal and check that the name matches the title deed.
What is the difference between A-Khata and B-Khata?
An A-Khata property fully complies with planning rules, so loans and building approvals are straightforward. A B-Khata property is in an unapproved layout or has deviations: it can be sold and taxed, but many banks will not lend against it and resale demand is thinner. Some B-Khata properties registered before 30 September 2024 can be converted to A-Khata by paying a penalty, reported at about 5% of the guidance value.
What is the rental yield in Bangalore?
Square Yards puts the citywide gross rental yield at about 3.4%, ranging from about 3.1% in Whitefield to 4.8% in Electronic City. ANAROCK puts Bengaluru at 4.6% for Q2 2026, the highest of India's major cities. Yields are still well below home loan rates of about 8%.
Is it a good time to buy property in Bangalore?
Supply is rising faster than demand. ANAROCK reports that launches rose 42% and unsold stock 34% in the year to June 2026 while sales rose 1%, and price growth has slowed to 8% to 9% on ANAROCK's and Knight Frank's figures. Buyers have more choice than a year ago, but home loans became dearer after the October 2026 repo rate increase.
Which areas of Bangalore will benefit from the metro?
The Yellow Line, open since August 2025, already serves Electronic City and Hosur Road. The Pink Line will serve Bannerghatta Road, JP Nagar and the central business district, and the Blue Line, due around 2027 to 2028, will run along the Outer Ring Road through KR Puram and Hebbal to the airport, benefiting Hebbal, Hennur, Yelahanka and Devanahalli.
What is the EMI on a ₹1 crore flat in Bangalore?
With a 20% down payment and an ₹80 lakh loan for 20 years at 8%, the EMI is about ₹66,900 a month. A similar flat would rent for about ₹28,300 a month at Bengaluru's average yield of 3.4%, so the EMI is about 2.4 times the rent.
Which is the best area in Bangalore under ₹1 crore?
At average asking prices, ₹1 crore buys about 1,075 sq ft in Electronic City, 1,040 sq ft in Devanahalli and 990 sq ft in Yelahanka: enough for a 2 BHK. Thanisandra, JP Nagar, Kanakapura Road and Sarjapur Road offer about 815 to 895 sq ft.
How much security deposit do landlords ask for in Bangalore?
Bengaluru has the highest deposits among India's big cities, typically 6 to 10 months' rent, according to the Housewise India Rent Index. Deposits in Mumbai and Pune are usually 3 to 6 months.
What should I check before buying a flat in Bangalore?
Check the project's Karnataka RERA registration, the e-Khata and whether it is A-Khata, the title deed and encumbrance certificate, the sanctioned building plan, and the occupancy certificate for a ready flat. Confirm the guidance value, property tax receipts and that there are no dues.
Whitefield or Sarjapur Road: which is better?
Whitefield is more established, with large tech parks, malls and the Purple Line metro, at about ₹14,500 per sq ft on average. Sarjapur Road is newer and slightly cheaper at about ₹12,250, with more new supply near the Outer Ring Road tech parks, and a higher gross yield of about 3.9% against Whitefield's 3.1%. Sarjapur Road has no metro yet.
What is the guidance value in Bangalore?
The guidance value is the government's minimum value for a property in an area, and stamp duty is charged on whichever is higher: the guidance value or the sale price. Square Yards lists registration rates of about ₹6,700 per sq ft in Electronic City and ₹6,250 in Devanahalli, well below asking prices. Check the exact value for your property on the Kaveri Online Services portal.
Related guides
How we compiled this guide
- Area prices are average asking prices for apartments from Square Yards' area pages, checked between June and October 2026. Asking prices are what sellers list, not final sale prices, and they move as listings change.
- City-wide trends, sales and supply come from research firms such as ANAROCK, Knight Frank, PropEquity, JLL and Crisil, as labelled under each chart. Each firm tracks different projects and periods, so we show their figures side by side rather than combining them.
- Calculated figures, such as floor area for a budget, EMIs (80% loan, 20 years, 8%), rent at a stated yield and buying costs, are our own arithmetic from those sources.
- Stamp duty and registration rates are taken from state rules as reported by the sources listed. Confirm the exact amount with the sub-registrar before you pay.
- Dates. This guide was published on 10 October 2026 and updated on 12 October 2026. We plan to review it in January 2027.
Sources and resources
- Square Yards: Bangalore property rates and area pages for Whitefield, Sarjapur Road, Electronic City, Hebbal, Koramangala, Indiranagar, Devanahalli, Yelahanka, Kanakapura Road, Hennur Road, Bannerghatta Road
- ANAROCK: Bengaluru Residential Market Viewpoints, Q2 2026, Q2 2025, Pan India Q2 2026, prices and yields since 2019 (Upstox), micro-market study (Business Standard)
- Knight Frank India, Bengaluru H1 2026 (press release)
- PropTiger Real Insight, Q2 2026 and NHB RESIDEX, Q3 FY26
- Housewise India Rent Index 2026 and Magicbricks Rental Index (Trade Brains)
- Stamp duty: PropNewz, BankBazaar
- Khata: e-Khata and B-Khata checklist (PropNewz)
- Metro: Yellow Line, Pink Line, Blue Line (Wikipedia), Pink Line opening (Swarajya), Pink Line safety inspection, October 2026 (Swarajya), Pink Line inauguration awaited (Deccan Herald)
- Official portals: Karnataka RERA, Kaveri Online Services (registration and guidance values), e-Aasthi / city corporation, BMRCL (Namma Metro)
This page is general information, and not financial, legal or tax advice. Figures are averages from the sources listed and will differ for individual properties.